Belizean vs Immigrants from Cabo Verde Unemployment Among Ages 16 to 19 years
COMPARE
Belizean
Immigrants from Cabo Verde
Unemployment Among Ages 16 to 19 years
Unemployment Among Ages 16 to 19 years Comparison
Belizeans
Immigrants from Cabo Verde
21.6%
UNEMPLOYMENT AMONG AGES 16 TO 19 YEARS
0.0/ 100
METRIC RATING
311th/ 347
METRIC RANK
18.4%
UNEMPLOYMENT AMONG AGES 16 TO 19 YEARS
2.0/ 100
METRIC RATING
240th/ 347
METRIC RANK
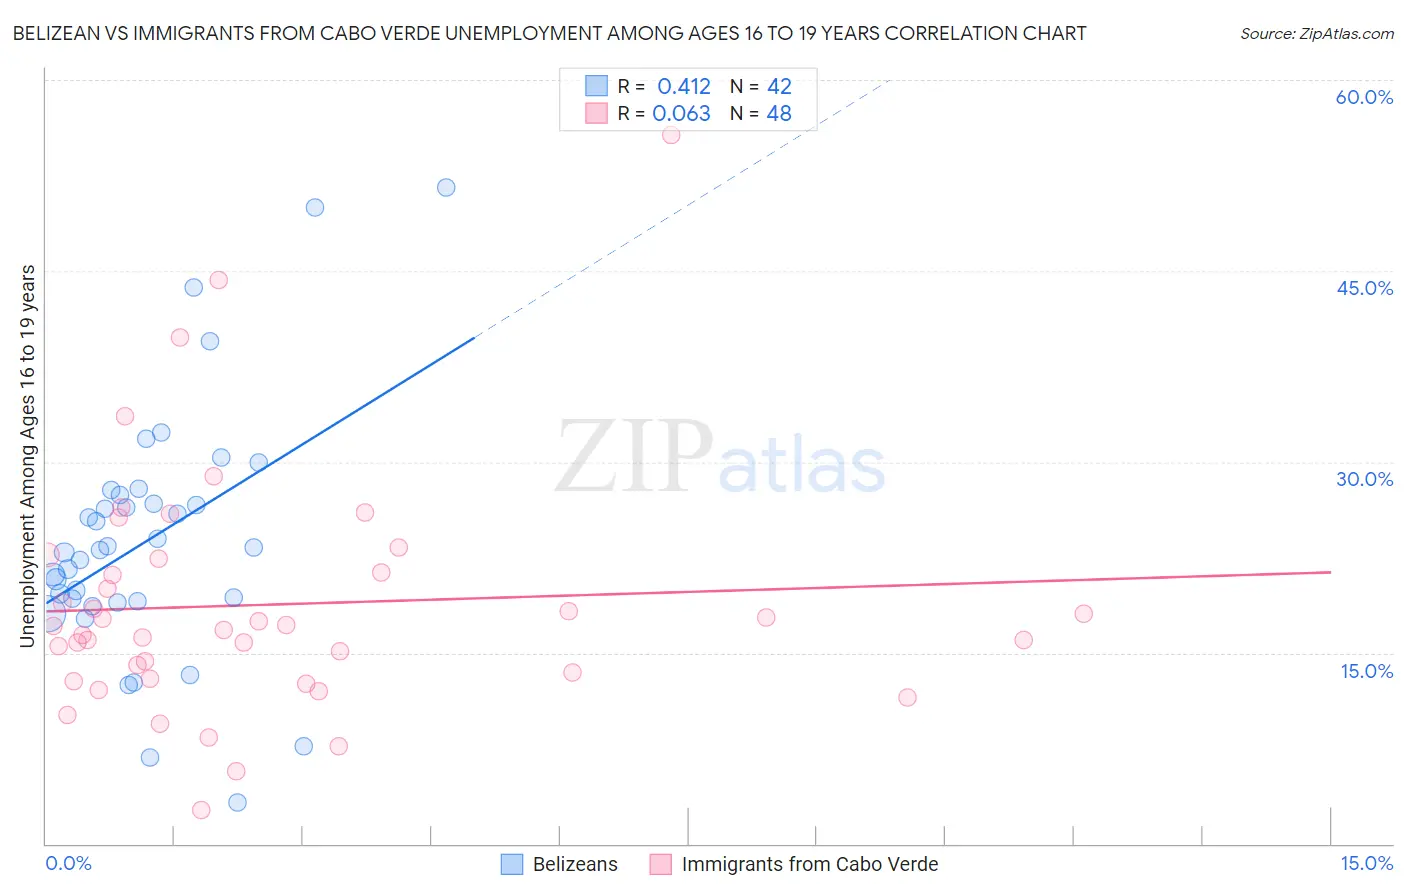
Belizean vs Immigrants from Cabo Verde Unemployment Among Ages 16 to 19 years Correlation Chart
The statistical analysis conducted on geographies consisting of 141,937,009 people shows a moderate positive correlation between the proportion of Belizeans and unemployment rate among population between the ages 16 and 19 in the United States with a correlation coefficient (R) of 0.412 and weighted average of 21.6%. Similarly, the statistical analysis conducted on geographies consisting of 37,702,404 people shows a slight positive correlation between the proportion of Immigrants from Cabo Verde and unemployment rate among population between the ages 16 and 19 in the United States with a correlation coefficient (R) of 0.063 and weighted average of 18.4%, a difference of 17.4%.
Unemployment Among Ages 16 to 19 years Correlation Summary
| Measurement | Belizean | Immigrants from Cabo Verde |
| Minimum | 3.2% | 2.7% |
| Maximum | 51.6% | 55.7% |
| Range | 48.4% | 53.0% |
| Mean | 23.9% | 18.8% |
| Median | 23.2% | 17.0% |
| Interquartile 25% (IQ1) | 19.1% | 13.3% |
| Interquartile 75% (IQ3) | 27.4% | 21.9% |
| Interquartile Range (IQR) | 8.3% | 8.6% |
| Standard Deviation (Sample) | 9.8% | 9.5% |
| Standard Deviation (Population) | 9.7% | 9.4% |
Similar Demographics by Unemployment Among Ages 16 to 19 years
Demographics Similar to Belizeans by Unemployment Among Ages 16 to 19 years
In terms of unemployment among ages 16 to 19 years, the demographic groups most similar to Belizeans are Vietnamese (21.5%, a difference of 0.22%), Houma (21.6%, a difference of 0.26%), Native/Alaskan (21.5%, a difference of 0.28%), Immigrants from Bangladesh (21.5%, a difference of 0.44%), and Jamaican (21.7%, a difference of 0.67%).
| Demographics | Rating | Rank | Unemployment Among Ages 16 to 19 years |
| Aleuts | 0.0 /100 | #304 | Tragic 21.2% |
| Immigrants | Senegal | 0.0 /100 | #305 | Tragic 21.2% |
| U.S. Virgin Islanders | 0.0 /100 | #306 | Tragic 21.3% |
| Blacks/African Americans | 0.0 /100 | #307 | Tragic 21.4% |
| Immigrants | Bangladesh | 0.0 /100 | #308 | Tragic 21.5% |
| Natives/Alaskans | 0.0 /100 | #309 | Tragic 21.5% |
| Vietnamese | 0.0 /100 | #310 | Tragic 21.5% |
| Belizeans | 0.0 /100 | #311 | Tragic 21.6% |
| Houma | 0.0 /100 | #312 | Tragic 21.6% |
| Jamaicans | 0.0 /100 | #313 | Tragic 21.7% |
| Alaska Natives | 0.0 /100 | #314 | Tragic 21.8% |
| Immigrants | Dominica | 0.0 /100 | #315 | Tragic 21.9% |
| Tohono O'odham | 0.0 /100 | #316 | Tragic 22.1% |
| Immigrants | Belize | 0.0 /100 | #317 | Tragic 22.2% |
| Immigrants | Jamaica | 0.0 /100 | #318 | Tragic 22.2% |
Demographics Similar to Immigrants from Cabo Verde by Unemployment Among Ages 16 to 19 years
In terms of unemployment among ages 16 to 19 years, the demographic groups most similar to Immigrants from Cabo Verde are Native Hawaiian (18.3%, a difference of 0.22%), South American (18.3%, a difference of 0.30%), Immigrants (18.3%, a difference of 0.32%), Immigrants from Colombia (18.3%, a difference of 0.33%), and French American Indian (18.3%, a difference of 0.40%).
| Demographics | Rating | Rank | Unemployment Among Ages 16 to 19 years |
| Seminole | 4.0 /100 | #233 | Tragic 18.2% |
| Colombians | 3.7 /100 | #234 | Tragic 18.3% |
| French American Indians | 2.9 /100 | #235 | Tragic 18.3% |
| Immigrants | Colombia | 2.7 /100 | #236 | Tragic 18.3% |
| Immigrants | Immigrants | 2.7 /100 | #237 | Tragic 18.3% |
| South Americans | 2.6 /100 | #238 | Tragic 18.3% |
| Native Hawaiians | 2.4 /100 | #239 | Tragic 18.3% |
| Immigrants | Cabo Verde | 2.0 /100 | #240 | Tragic 18.4% |
| Immigrants | Ukraine | 1.3 /100 | #241 | Tragic 18.5% |
| Moroccans | 1.1 /100 | #242 | Tragic 18.5% |
| Mexicans | 0.9 /100 | #243 | Tragic 18.5% |
| Guatemalans | 0.8 /100 | #244 | Tragic 18.6% |
| Immigrants | Belarus | 0.8 /100 | #245 | Tragic 18.6% |
| Immigrants | South America | 0.5 /100 | #246 | Tragic 18.7% |
| Immigrants | Israel | 0.5 /100 | #247 | Tragic 18.7% |