Egyptian vs Immigrants from Hungary Unemployment Among Youth under 25 years
COMPARE
Egyptian
Immigrants from Hungary
Unemployment Among Youth under 25 years
Unemployment Among Youth under 25 years Comparison
Egyptians
Immigrants from Hungary
11.7%
UNEMPLOYMENT AMONG YOUTH UNDER 25 YEARS
26.9/ 100
METRIC RATING
196th/ 347
METRIC RANK
11.4%
UNEMPLOYMENT AMONG YOUTH UNDER 25 YEARS
86.0/ 100
METRIC RATING
128th/ 347
METRIC RANK
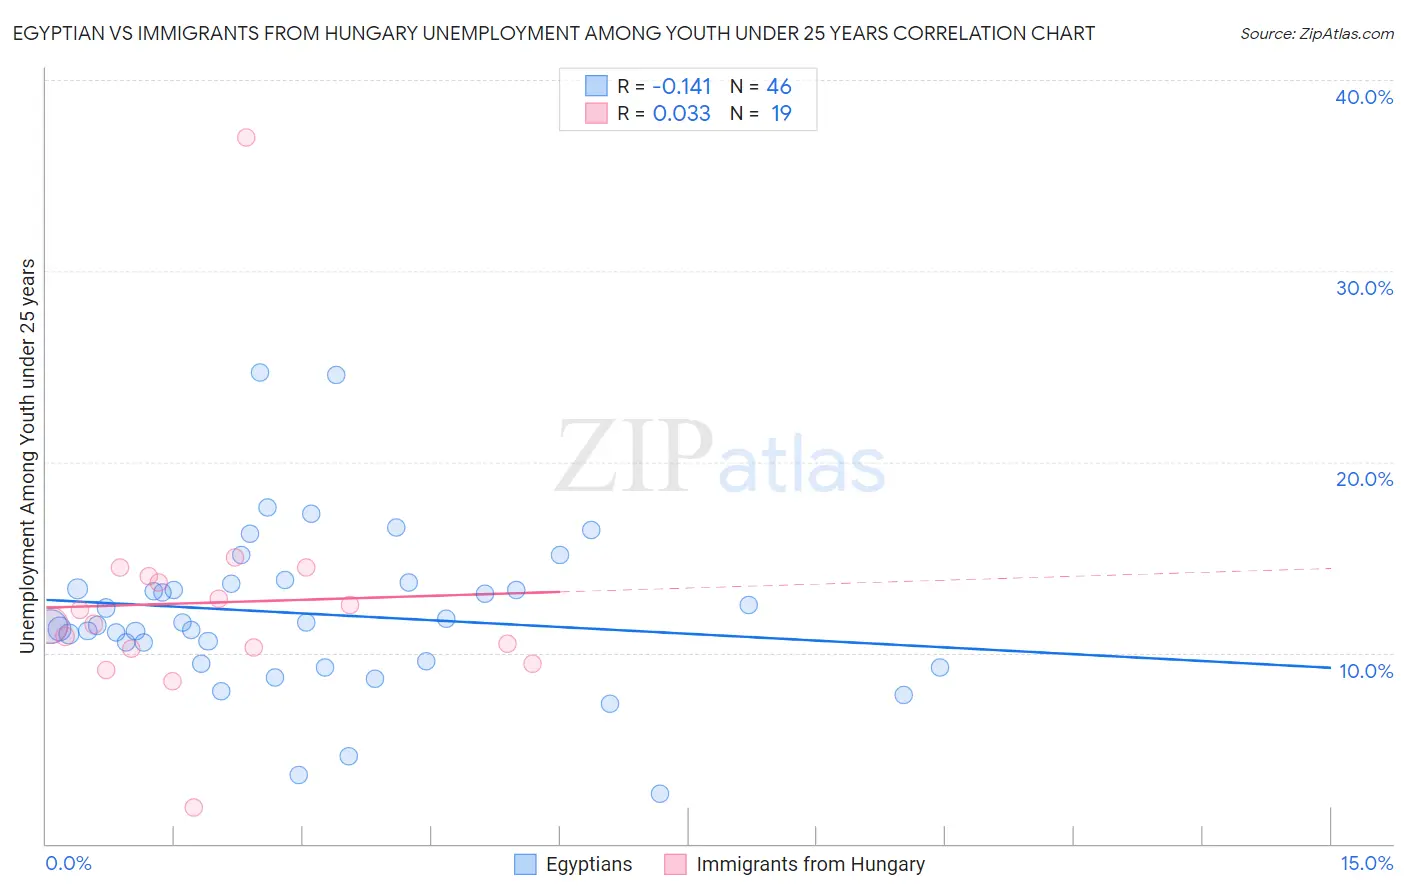
Egyptian vs Immigrants from Hungary Unemployment Among Youth under 25 years Correlation Chart
The statistical analysis conducted on geographies consisting of 275,376,024 people shows a poor negative correlation between the proportion of Egyptians and unemployment rate among youth under the age of 25 in the United States with a correlation coefficient (R) of -0.141 and weighted average of 11.7%. Similarly, the statistical analysis conducted on geographies consisting of 194,362,446 people shows no correlation between the proportion of Immigrants from Hungary and unemployment rate among youth under the age of 25 in the United States with a correlation coefficient (R) of 0.033 and weighted average of 11.4%, a difference of 2.9%.
Unemployment Among Youth under 25 years Correlation Summary
| Measurement | Egyptian | Immigrants from Hungary |
| Minimum | 2.6% | 1.9% |
| Maximum | 24.7% | 37.0% |
| Range | 22.1% | 35.1% |
| Mean | 12.0% | 12.6% |
| Median | 11.5% | 11.5% |
| Interquartile 25% (IQ1) | 9.6% | 10.2% |
| Interquartile 75% (IQ3) | 13.6% | 14.0% |
| Interquartile Range (IQR) | 4.0% | 3.8% |
| Standard Deviation (Sample) | 4.2% | 6.6% |
| Standard Deviation (Population) | 4.2% | 6.4% |
Similar Demographics by Unemployment Among Youth under 25 years
Demographics Similar to Egyptians by Unemployment Among Youth under 25 years
In terms of unemployment among youth under 25 years, the demographic groups most similar to Egyptians are Paraguayan (11.7%, a difference of 0.010%), Seminole (11.7%, a difference of 0.050%), Immigrants from Sri Lanka (11.7%, a difference of 0.050%), Cypriot (11.7%, a difference of 0.080%), and Immigrants from Russia (11.7%, a difference of 0.080%).
| Demographics | Rating | Rank | Unemployment Among Youth under 25 years |
| Japanese | 30.8 /100 | #189 | Fair 11.7% |
| Portuguese | 30.3 /100 | #190 | Fair 11.7% |
| Cypriots | 28.5 /100 | #191 | Fair 11.7% |
| Immigrants | Russia | 28.5 /100 | #192 | Fair 11.7% |
| Seminole | 27.9 /100 | #193 | Fair 11.7% |
| Immigrants | Sri Lanka | 27.8 /100 | #194 | Fair 11.7% |
| Paraguayans | 27.2 /100 | #195 | Fair 11.7% |
| Egyptians | 26.9 /100 | #196 | Fair 11.7% |
| Koreans | 23.9 /100 | #197 | Fair 11.7% |
| Cherokee | 21.2 /100 | #198 | Fair 11.8% |
| Immigrants | Colombia | 20.9 /100 | #199 | Fair 11.8% |
| Arabs | 18.0 /100 | #200 | Poor 11.8% |
| Palestinians | 16.0 /100 | #201 | Poor 11.8% |
| Marshallese | 15.8 /100 | #202 | Poor 11.8% |
| Immigrants | Peru | 15.3 /100 | #203 | Poor 11.8% |
Demographics Similar to Immigrants from Hungary by Unemployment Among Youth under 25 years
In terms of unemployment among youth under 25 years, the demographic groups most similar to Immigrants from Hungary are Greek (11.4%, a difference of 0.020%), Turkish (11.4%, a difference of 0.020%), Hungarian (11.4%, a difference of 0.030%), Canadian (11.4%, a difference of 0.050%), and Immigrants from Argentina (11.4%, a difference of 0.10%).
| Demographics | Rating | Rank | Unemployment Among Youth under 25 years |
| Slovaks | 88.9 /100 | #121 | Excellent 11.4% |
| Immigrants | Micronesia | 88.1 /100 | #122 | Excellent 11.4% |
| Basques | 87.8 /100 | #123 | Excellent 11.4% |
| Italians | 87.2 /100 | #124 | Excellent 11.4% |
| Immigrants | Argentina | 87.2 /100 | #125 | Excellent 11.4% |
| Canadians | 86.6 /100 | #126 | Excellent 11.4% |
| Greeks | 86.2 /100 | #127 | Excellent 11.4% |
| Immigrants | Hungary | 86.0 /100 | #128 | Excellent 11.4% |
| Turks | 85.8 /100 | #129 | Excellent 11.4% |
| Hungarians | 85.7 /100 | #130 | Excellent 11.4% |
| Immigrants | Spain | 84.6 /100 | #131 | Excellent 11.4% |
| Ethiopians | 83.2 /100 | #132 | Excellent 11.4% |
| Lebanese | 83.1 /100 | #133 | Excellent 11.4% |
| Immigrants | Chile | 80.4 /100 | #134 | Excellent 11.4% |
| Immigrants | Oceania | 80.2 /100 | #135 | Excellent 11.4% |