African vs Immigrants from Hungary Unemployment Among Youth under 25 years
COMPARE
African
Immigrants from Hungary
Unemployment Among Youth under 25 years
Unemployment Among Youth under 25 years Comparison
Africans
Immigrants from Hungary
13.2%
UNEMPLOYMENT AMONG YOUTH UNDER 25 YEARS
0.0/ 100
METRIC RATING
278th/ 347
METRIC RANK
11.4%
UNEMPLOYMENT AMONG YOUTH UNDER 25 YEARS
86.0/ 100
METRIC RATING
128th/ 347
METRIC RANK
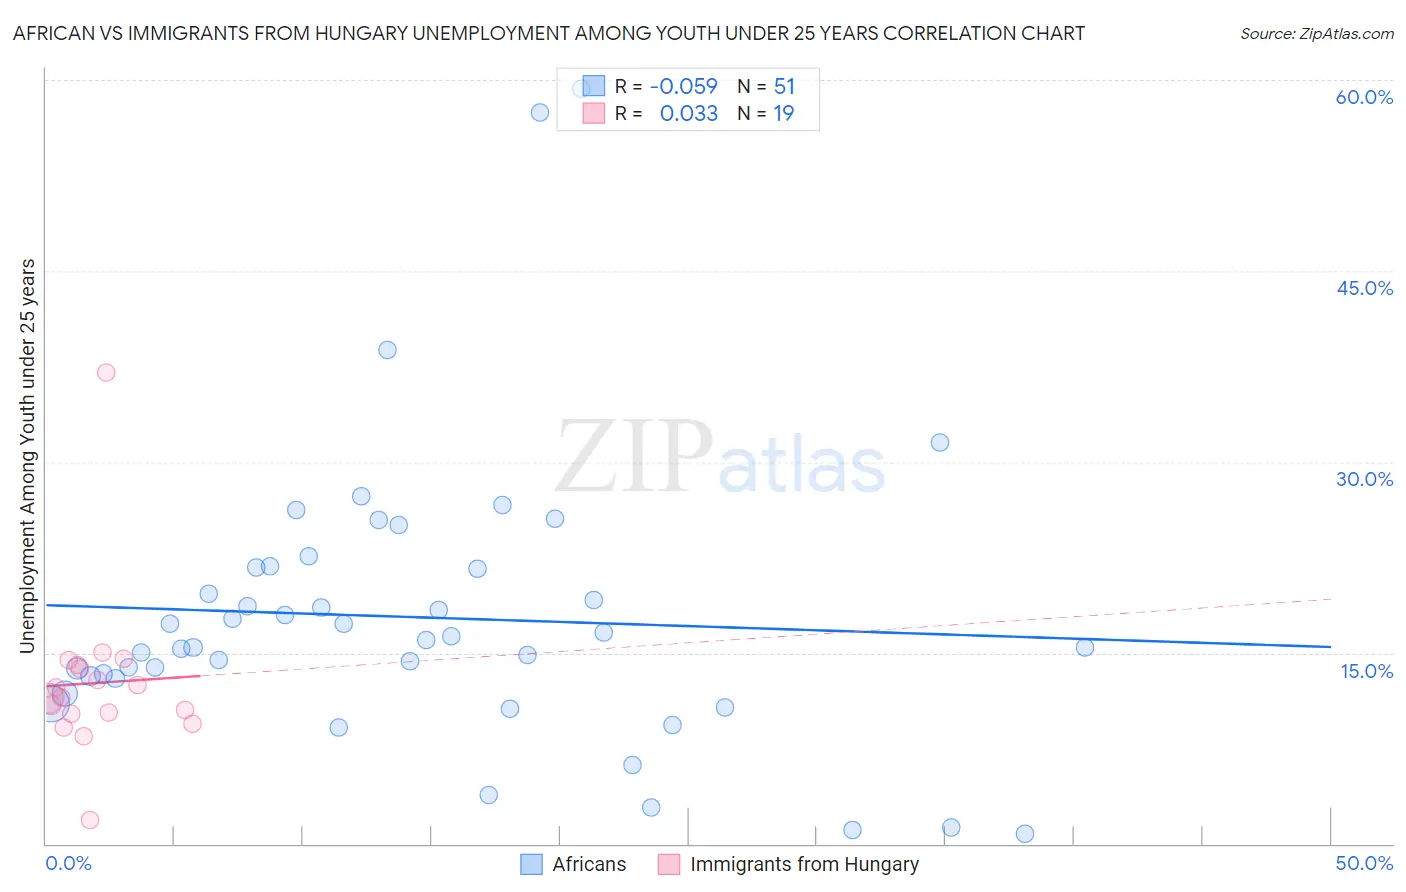
African vs Immigrants from Hungary Unemployment Among Youth under 25 years Correlation Chart
The statistical analysis conducted on geographies consisting of 462,952,151 people shows a slight negative correlation between the proportion of Africans and unemployment rate among youth under the age of 25 in the United States with a correlation coefficient (R) of -0.059 and weighted average of 13.2%. Similarly, the statistical analysis conducted on geographies consisting of 194,362,446 people shows no correlation between the proportion of Immigrants from Hungary and unemployment rate among youth under the age of 25 in the United States with a correlation coefficient (R) of 0.033 and weighted average of 11.4%, a difference of 15.5%.
Unemployment Among Youth under 25 years Correlation Summary
| Measurement | African | Immigrants from Hungary |
| Minimum | 0.80% | 1.9% |
| Maximum | 59.3% | 37.0% |
| Range | 58.5% | 35.1% |
| Mean | 17.8% | 12.6% |
| Median | 16.0% | 11.5% |
| Interquartile 25% (IQ1) | 13.0% | 10.2% |
| Interquartile 75% (IQ3) | 21.7% | 14.0% |
| Interquartile Range (IQR) | 8.7% | 3.8% |
| Standard Deviation (Sample) | 11.2% | 6.6% |
| Standard Deviation (Population) | 11.1% | 6.4% |
Similar Demographics by Unemployment Among Youth under 25 years
Demographics Similar to Africans by Unemployment Among Youth under 25 years
In terms of unemployment among youth under 25 years, the demographic groups most similar to Africans are Bahamian (13.1%, a difference of 0.26%), Immigrants from Uzbekistan (13.1%, a difference of 0.42%), Cajun (13.2%, a difference of 0.67%), Bermudan (13.0%, a difference of 0.85%), and Ute (13.3%, a difference of 0.92%).
| Demographics | Rating | Rank | Unemployment Among Youth under 25 years |
| Immigrants | Bahamas | 0.0 /100 | #271 | Tragic 12.9% |
| Cape Verdeans | 0.0 /100 | #272 | Tragic 12.9% |
| Nigerians | 0.0 /100 | #273 | Tragic 13.0% |
| Immigrants | Nigeria | 0.0 /100 | #274 | Tragic 13.0% |
| Bermudans | 0.0 /100 | #275 | Tragic 13.0% |
| Immigrants | Uzbekistan | 0.0 /100 | #276 | Tragic 13.1% |
| Bahamians | 0.0 /100 | #277 | Tragic 13.1% |
| Africans | 0.0 /100 | #278 | Tragic 13.2% |
| Cajuns | 0.0 /100 | #279 | Tragic 13.2% |
| Ute | 0.0 /100 | #280 | Tragic 13.3% |
| Armenians | 0.0 /100 | #281 | Tragic 13.3% |
| Sierra Leoneans | 0.0 /100 | #282 | Tragic 13.3% |
| Immigrants | Cameroon | 0.0 /100 | #283 | Tragic 13.3% |
| Lumbee | 0.0 /100 | #284 | Tragic 13.3% |
| Ghanaians | 0.0 /100 | #285 | Tragic 13.3% |
Demographics Similar to Immigrants from Hungary by Unemployment Among Youth under 25 years
In terms of unemployment among youth under 25 years, the demographic groups most similar to Immigrants from Hungary are Greek (11.4%, a difference of 0.020%), Turkish (11.4%, a difference of 0.020%), Hungarian (11.4%, a difference of 0.030%), Canadian (11.4%, a difference of 0.050%), and Immigrants from Argentina (11.4%, a difference of 0.10%).
| Demographics | Rating | Rank | Unemployment Among Youth under 25 years |
| Slovaks | 88.9 /100 | #121 | Excellent 11.4% |
| Immigrants | Micronesia | 88.1 /100 | #122 | Excellent 11.4% |
| Basques | 87.8 /100 | #123 | Excellent 11.4% |
| Italians | 87.2 /100 | #124 | Excellent 11.4% |
| Immigrants | Argentina | 87.2 /100 | #125 | Excellent 11.4% |
| Canadians | 86.6 /100 | #126 | Excellent 11.4% |
| Greeks | 86.2 /100 | #127 | Excellent 11.4% |
| Immigrants | Hungary | 86.0 /100 | #128 | Excellent 11.4% |
| Turks | 85.8 /100 | #129 | Excellent 11.4% |
| Hungarians | 85.7 /100 | #130 | Excellent 11.4% |
| Immigrants | Spain | 84.6 /100 | #131 | Excellent 11.4% |
| Ethiopians | 83.2 /100 | #132 | Excellent 11.4% |
| Lebanese | 83.1 /100 | #133 | Excellent 11.4% |
| Immigrants | Chile | 80.4 /100 | #134 | Excellent 11.4% |
| Immigrants | Oceania | 80.2 /100 | #135 | Excellent 11.4% |