Ecuadorian vs Immigrants from Cameroon Female Unemployment
COMPARE
Ecuadorian
Immigrants from Cameroon
Female Unemployment
Female Unemployment Comparison
Ecuadorians
Immigrants from Cameroon
6.3%
FEMALE UNEMPLOYMENT
0.0/ 100
METRIC RATING
309th/ 347
METRIC RANK
5.7%
FEMALE UNEMPLOYMENT
0.6/ 100
METRIC RATING
255th/ 347
METRIC RANK
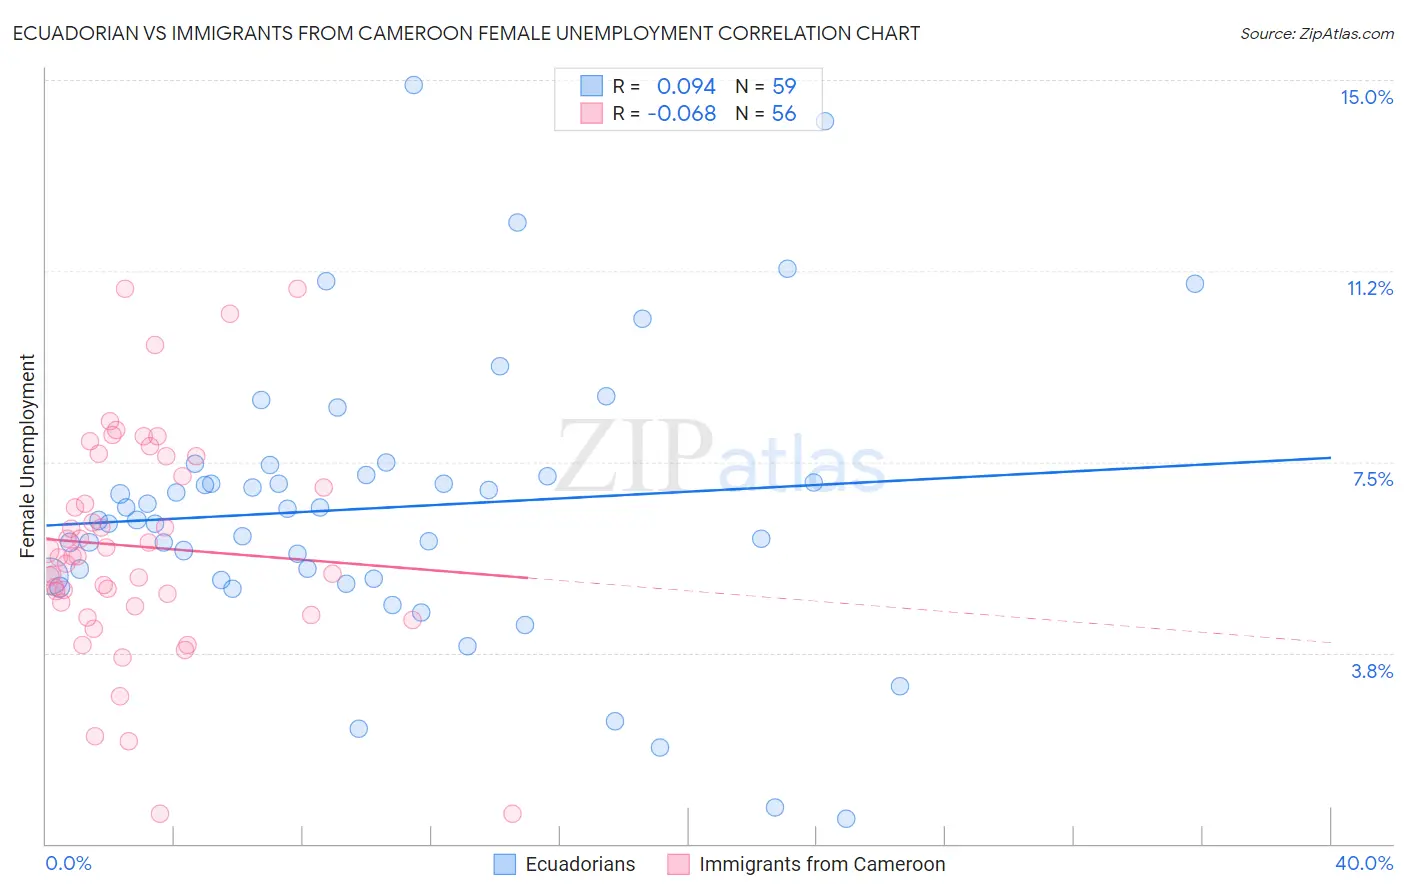
Ecuadorian vs Immigrants from Cameroon Female Unemployment Correlation Chart
The statistical analysis conducted on geographies consisting of 317,059,726 people shows a slight positive correlation between the proportion of Ecuadorians and unemploymnet rate among females in the United States with a correlation coefficient (R) of 0.094 and weighted average of 6.3%. Similarly, the statistical analysis conducted on geographies consisting of 130,670,157 people shows a slight negative correlation between the proportion of Immigrants from Cameroon and unemploymnet rate among females in the United States with a correlation coefficient (R) of -0.068 and weighted average of 5.7%, a difference of 10.7%.
Female Unemployment Correlation Summary
| Measurement | Ecuadorian | Immigrants from Cameroon |
| Minimum | 0.50% | 0.60% |
| Maximum | 14.9% | 10.9% |
| Range | 14.4% | 10.3% |
| Mean | 6.6% | 5.8% |
| Median | 6.4% | 5.6% |
| Interquartile 25% (IQ1) | 5.2% | 4.7% |
| Interquartile 75% (IQ3) | 7.2% | 7.4% |
| Interquartile Range (IQR) | 2.0% | 2.7% |
| Standard Deviation (Sample) | 2.8% | 2.2% |
| Standard Deviation (Population) | 2.7% | 2.2% |
Similar Demographics by Female Unemployment
Demographics Similar to Ecuadorians by Female Unemployment
In terms of female unemployment, the demographic groups most similar to Ecuadorians are Central American Indian (6.3%, a difference of 0.41%), Immigrants from Mexico (6.3%, a difference of 0.54%), Hispanic or Latino (6.2%, a difference of 0.58%), Shoshone (6.2%, a difference of 0.64%), and Immigrants from Central America (6.2%, a difference of 0.66%).
| Demographics | Rating | Rank | Female Unemployment |
| U.S. Virgin Islanders | 0.0 /100 | #302 | Tragic 6.2% |
| Barbadians | 0.0 /100 | #303 | Tragic 6.2% |
| Immigrants | Jamaica | 0.0 /100 | #304 | Tragic 6.2% |
| Spanish American Indians | 0.0 /100 | #305 | Tragic 6.2% |
| Immigrants | Central America | 0.0 /100 | #306 | Tragic 6.2% |
| Shoshone | 0.0 /100 | #307 | Tragic 6.2% |
| Hispanics or Latinos | 0.0 /100 | #308 | Tragic 6.2% |
| Ecuadorians | 0.0 /100 | #309 | Tragic 6.3% |
| Central American Indians | 0.0 /100 | #310 | Tragic 6.3% |
| Immigrants | Mexico | 0.0 /100 | #311 | Tragic 6.3% |
| Immigrants | Grenada | 0.0 /100 | #312 | Tragic 6.3% |
| Belizeans | 0.0 /100 | #313 | Tragic 6.3% |
| Immigrants | Ecuador | 0.0 /100 | #314 | Tragic 6.4% |
| Pueblo | 0.0 /100 | #315 | Tragic 6.4% |
| Houma | 0.0 /100 | #316 | Tragic 6.4% |
Demographics Similar to Immigrants from Cameroon by Female Unemployment
In terms of female unemployment, the demographic groups most similar to Immigrants from Cameroon are Immigrants from Sierra Leone (5.7%, a difference of 0.040%), Immigrants (5.7%, a difference of 0.040%), Cajun (5.7%, a difference of 0.18%), Assyrian/Chaldean/Syriac (5.6%, a difference of 0.38%), and Immigrants from Syria (5.6%, a difference of 0.44%).
| Demographics | Rating | Rank | Female Unemployment |
| Cree | 1.0 /100 | #248 | Tragic 5.6% |
| Immigrants | Uzbekistan | 1.0 /100 | #249 | Tragic 5.6% |
| Immigrants | Syria | 0.8 /100 | #250 | Tragic 5.6% |
| Assyrians/Chaldeans/Syriacs | 0.8 /100 | #251 | Tragic 5.6% |
| Cajuns | 0.7 /100 | #252 | Tragic 5.7% |
| Immigrants | Sierra Leone | 0.6 /100 | #253 | Tragic 5.7% |
| Immigrants | Immigrants | 0.6 /100 | #254 | Tragic 5.7% |
| Immigrants | Cameroon | 0.6 /100 | #255 | Tragic 5.7% |
| Sub-Saharan Africans | 0.4 /100 | #256 | Tragic 5.7% |
| Dutch West Indians | 0.3 /100 | #257 | Tragic 5.7% |
| Immigrants | Portugal | 0.2 /100 | #258 | Tragic 5.8% |
| Immigrants | Fiji | 0.2 /100 | #259 | Tragic 5.8% |
| Nigerians | 0.2 /100 | #260 | Tragic 5.8% |
| Kiowa | 0.1 /100 | #261 | Tragic 5.8% |
| Immigrants | Nigeria | 0.1 /100 | #262 | Tragic 5.8% |