Dominican vs Puget Sound Salish Unemployment Among Ages 16 to 19 years
COMPARE
Dominican
Puget Sound Salish
Unemployment Among Ages 16 to 19 years
Unemployment Among Ages 16 to 19 years Comparison
Dominicans
Puget Sound Salish
23.6%
UNEMPLOYMENT AMONG AGES 16 TO 19 YEARS
0.0/ 100
METRIC RATING
330th/ 347
METRIC RANK
18.7%
UNEMPLOYMENT AMONG AGES 16 TO 19 YEARS
0.5/ 100
METRIC RATING
249th/ 347
METRIC RANK
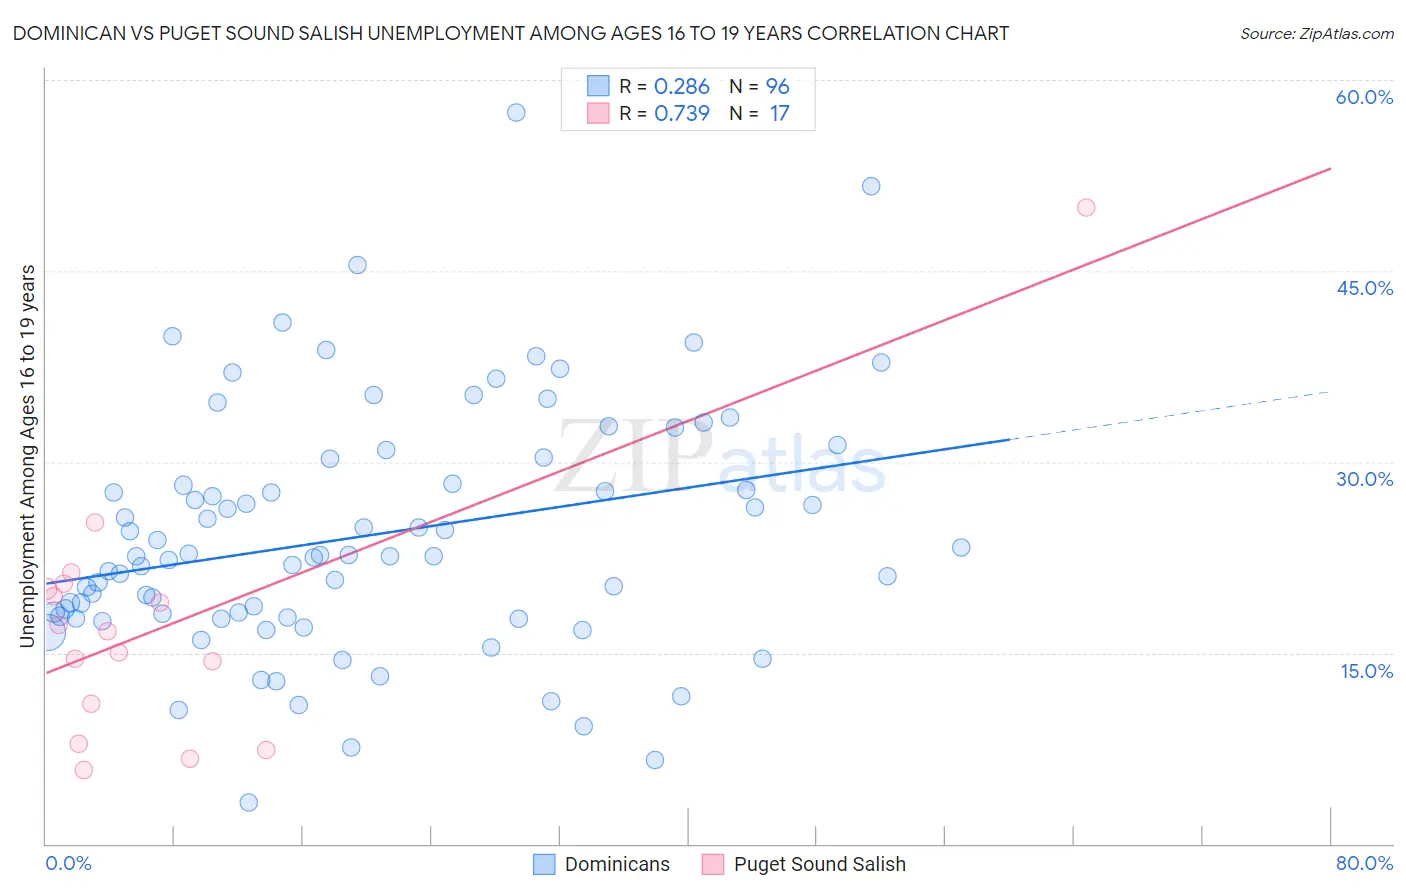
Dominican vs Puget Sound Salish Unemployment Among Ages 16 to 19 years Correlation Chart
The statistical analysis conducted on geographies consisting of 338,410,900 people shows a weak positive correlation between the proportion of Dominicans and unemployment rate among population between the ages 16 and 19 in the United States with a correlation coefficient (R) of 0.286 and weighted average of 23.6%. Similarly, the statistical analysis conducted on geographies consisting of 45,291,047 people shows a strong positive correlation between the proportion of Puget Sound Salish and unemployment rate among population between the ages 16 and 19 in the United States with a correlation coefficient (R) of 0.739 and weighted average of 18.7%, a difference of 26.5%.
Unemployment Among Ages 16 to 19 years Correlation Summary
| Measurement | Dominican | Puget Sound Salish |
| Minimum | 3.2% | 5.8% |
| Maximum | 57.4% | 50.0% |
| Range | 54.2% | 44.2% |
| Mean | 24.2% | 17.2% |
| Median | 22.6% | 16.7% |
| Interquartile 25% (IQ1) | 17.8% | 9.4% |
| Interquartile 75% (IQ3) | 29.3% | 20.2% |
| Interquartile Range (IQR) | 11.4% | 10.8% |
| Standard Deviation (Sample) | 9.6% | 10.2% |
| Standard Deviation (Population) | 9.6% | 9.9% |
Similar Demographics by Unemployment Among Ages 16 to 19 years
Demographics Similar to Dominicans by Unemployment Among Ages 16 to 19 years
In terms of unemployment among ages 16 to 19 years, the demographic groups most similar to Dominicans are Tlingit-Haida (23.5%, a difference of 0.44%), British West Indian (24.0%, a difference of 1.4%), Immigrants from Dominican Republic (23.3%, a difference of 1.5%), Immigrants from Barbados (24.0%, a difference of 1.6%), and Pima (23.1%, a difference of 2.2%).
| Demographics | Rating | Rank | Unemployment Among Ages 16 to 19 years |
| Yakama | 0.0 /100 | #323 | Tragic 22.5% |
| Immigrants | Armenia | 0.0 /100 | #324 | Tragic 22.6% |
| Trinidadians and Tobagonians | 0.0 /100 | #325 | Tragic 22.6% |
| Immigrants | Trinidad and Tobago | 0.0 /100 | #326 | Tragic 23.1% |
| Pima | 0.0 /100 | #327 | Tragic 23.1% |
| Immigrants | Dominican Republic | 0.0 /100 | #328 | Tragic 23.3% |
| Tlingit-Haida | 0.0 /100 | #329 | Tragic 23.5% |
| Dominicans | 0.0 /100 | #330 | Tragic 23.6% |
| British West Indians | 0.0 /100 | #331 | Tragic 24.0% |
| Immigrants | Barbados | 0.0 /100 | #332 | Tragic 24.0% |
| Paiute | 0.0 /100 | #333 | Tragic 24.4% |
| Guyanese | 0.0 /100 | #334 | Tragic 24.8% |
| Arapaho | 0.0 /100 | #335 | Tragic 25.2% |
| Kiowa | 0.0 /100 | #336 | Tragic 25.2% |
| Immigrants | Guyana | 0.0 /100 | #337 | Tragic 25.5% |
Demographics Similar to Puget Sound Salish by Unemployment Among Ages 16 to 19 years
In terms of unemployment among ages 16 to 19 years, the demographic groups most similar to Puget Sound Salish are Delaware (18.7%, a difference of 0.060%), Immigrants from Israel (18.7%, a difference of 0.090%), Panamanian (18.7%, a difference of 0.11%), Immigrants from South America (18.7%, a difference of 0.14%), and Subsaharan African (18.7%, a difference of 0.22%).
| Demographics | Rating | Rank | Unemployment Among Ages 16 to 19 years |
| Moroccans | 1.1 /100 | #242 | Tragic 18.5% |
| Mexicans | 0.9 /100 | #243 | Tragic 18.5% |
| Guatemalans | 0.8 /100 | #244 | Tragic 18.6% |
| Immigrants | Belarus | 0.8 /100 | #245 | Tragic 18.6% |
| Immigrants | South America | 0.5 /100 | #246 | Tragic 18.7% |
| Immigrants | Israel | 0.5 /100 | #247 | Tragic 18.7% |
| Delaware | 0.5 /100 | #248 | Tragic 18.7% |
| Puget Sound Salish | 0.5 /100 | #249 | Tragic 18.7% |
| Panamanians | 0.4 /100 | #250 | Tragic 18.7% |
| Sub-Saharan Africans | 0.4 /100 | #251 | Tragic 18.7% |
| Immigrants | Guatemala | 0.4 /100 | #252 | Tragic 18.7% |
| Central Americans | 0.3 /100 | #253 | Tragic 18.8% |
| Apache | 0.3 /100 | #254 | Tragic 18.8% |
| Immigrants | Cameroon | 0.3 /100 | #255 | Tragic 18.8% |
| Mexican American Indians | 0.3 /100 | #256 | Tragic 18.8% |