Danish vs Puget Sound Salish Unemployment Among Ages 16 to 19 years
COMPARE
Danish
Puget Sound Salish
Unemployment Among Ages 16 to 19 years
Unemployment Among Ages 16 to 19 years Comparison
Danes
Puget Sound Salish
15.2%
UNEMPLOYMENT AMONG AGES 16 TO 19 YEARS
100.0/ 100
METRIC RATING
4th/ 347
METRIC RANK
18.7%
UNEMPLOYMENT AMONG AGES 16 TO 19 YEARS
0.5/ 100
METRIC RATING
249th/ 347
METRIC RANK
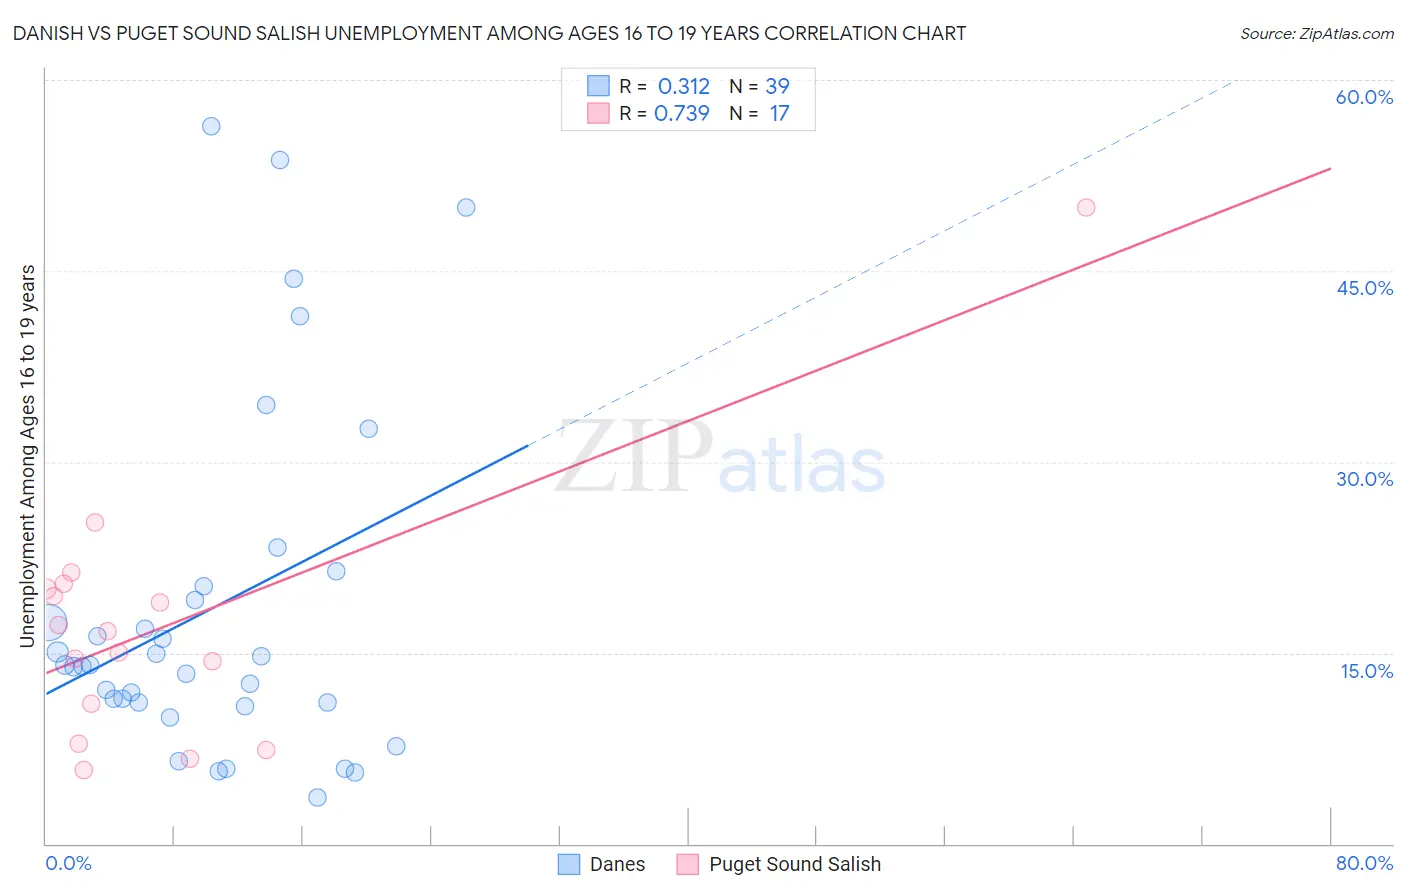
Danish vs Puget Sound Salish Unemployment Among Ages 16 to 19 years Correlation Chart
The statistical analysis conducted on geographies consisting of 436,960,634 people shows a mild positive correlation between the proportion of Danes and unemployment rate among population between the ages 16 and 19 in the United States with a correlation coefficient (R) of 0.312 and weighted average of 15.2%. Similarly, the statistical analysis conducted on geographies consisting of 45,291,047 people shows a strong positive correlation between the proportion of Puget Sound Salish and unemployment rate among population between the ages 16 and 19 in the United States with a correlation coefficient (R) of 0.739 and weighted average of 18.7%, a difference of 23.1%.
Unemployment Among Ages 16 to 19 years Correlation Summary
| Measurement | Danish | Puget Sound Salish |
| Minimum | 3.6% | 5.8% |
| Maximum | 56.4% | 50.0% |
| Range | 52.8% | 44.2% |
| Mean | 18.5% | 17.2% |
| Median | 14.1% | 16.7% |
| Interquartile 25% (IQ1) | 11.1% | 9.4% |
| Interquartile 75% (IQ3) | 20.3% | 20.2% |
| Interquartile Range (IQR) | 9.2% | 10.8% |
| Standard Deviation (Sample) | 13.7% | 10.2% |
| Standard Deviation (Population) | 13.5% | 9.9% |
Similar Demographics by Unemployment Among Ages 16 to 19 years
Demographics Similar to Danes by Unemployment Among Ages 16 to 19 years
In terms of unemployment among ages 16 to 19 years, the demographic groups most similar to Danes are Immigrants from Somalia (15.3%, a difference of 0.60%), Luxembourger (15.1%, a difference of 0.75%), Swedish (15.3%, a difference of 0.87%), Immigrants from Bosnia and Herzegovina (15.3%, a difference of 1.0%), and Immigrants from India (15.0%, a difference of 1.2%).
| Demographics | Rating | Rank | Unemployment Among Ages 16 to 19 years |
| Norwegians | 100.0 /100 | #1 | Exceptional 14.5% |
| Immigrants | India | 100.0 /100 | #2 | Exceptional 15.0% |
| Luxembourgers | 100.0 /100 | #3 | Exceptional 15.1% |
| Danes | 100.0 /100 | #4 | Exceptional 15.2% |
| Immigrants | Somalia | 100.0 /100 | #5 | Exceptional 15.3% |
| Swedes | 100.0 /100 | #6 | Exceptional 15.3% |
| Immigrants | Bosnia and Herzegovina | 100.0 /100 | #7 | Exceptional 15.3% |
| Czechs | 100.0 /100 | #8 | Exceptional 15.4% |
| Scandinavians | 100.0 /100 | #9 | Exceptional 15.4% |
| Zimbabweans | 100.0 /100 | #10 | Exceptional 15.4% |
| Indonesians | 100.0 /100 | #11 | Exceptional 15.5% |
| Taiwanese | 100.0 /100 | #12 | Exceptional 15.5% |
| Immigrants | Burma/Myanmar | 100.0 /100 | #13 | Exceptional 15.6% |
| Immigrants | Zaire | 100.0 /100 | #14 | Exceptional 15.6% |
| Yugoslavians | 100.0 /100 | #15 | Exceptional 15.6% |
Demographics Similar to Puget Sound Salish by Unemployment Among Ages 16 to 19 years
In terms of unemployment among ages 16 to 19 years, the demographic groups most similar to Puget Sound Salish are Delaware (18.7%, a difference of 0.060%), Immigrants from Israel (18.7%, a difference of 0.090%), Panamanian (18.7%, a difference of 0.11%), Immigrants from South America (18.7%, a difference of 0.14%), and Subsaharan African (18.7%, a difference of 0.22%).
| Demographics | Rating | Rank | Unemployment Among Ages 16 to 19 years |
| Moroccans | 1.1 /100 | #242 | Tragic 18.5% |
| Mexicans | 0.9 /100 | #243 | Tragic 18.5% |
| Guatemalans | 0.8 /100 | #244 | Tragic 18.6% |
| Immigrants | Belarus | 0.8 /100 | #245 | Tragic 18.6% |
| Immigrants | South America | 0.5 /100 | #246 | Tragic 18.7% |
| Immigrants | Israel | 0.5 /100 | #247 | Tragic 18.7% |
| Delaware | 0.5 /100 | #248 | Tragic 18.7% |
| Puget Sound Salish | 0.5 /100 | #249 | Tragic 18.7% |
| Panamanians | 0.4 /100 | #250 | Tragic 18.7% |
| Sub-Saharan Africans | 0.4 /100 | #251 | Tragic 18.7% |
| Immigrants | Guatemala | 0.4 /100 | #252 | Tragic 18.7% |
| Central Americans | 0.3 /100 | #253 | Tragic 18.8% |
| Apache | 0.3 /100 | #254 | Tragic 18.8% |
| Immigrants | Cameroon | 0.3 /100 | #255 | Tragic 18.8% |
| Mexican American Indians | 0.3 /100 | #256 | Tragic 18.8% |