Czech vs Taiwanese Unemployment Among Women with Children Ages 6 to 17 years
COMPARE
Czech
Taiwanese
Unemployment Among Women with Children Ages 6 to 17 years
Unemployment Among Women with Children Ages 6 to 17 years Comparison
Czechs
Taiwanese
8.7%
UNEMPLOYMENT AMONG WOMEN WITH CHILDREN AGES 6 TO 17 YEARS
94.4/ 100
METRIC RATING
127th/ 347
METRIC RANK
6.5%
UNEMPLOYMENT AMONG WOMEN WITH CHILDREN AGES 6 TO 17 YEARS
100.0/ 100
METRIC RATING
1st/ 347
METRIC RANK
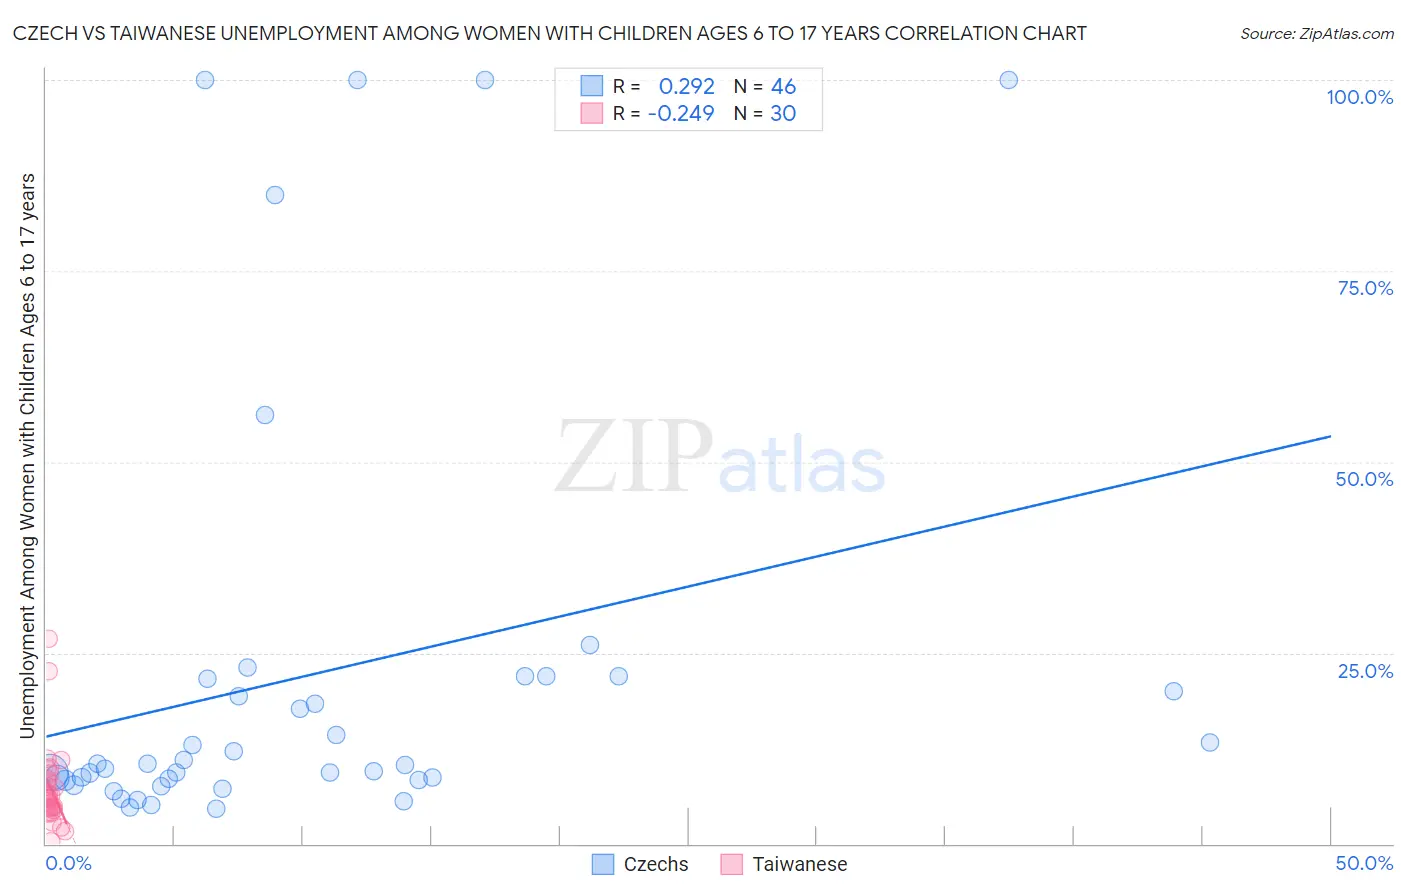
Czech vs Taiwanese Unemployment Among Women with Children Ages 6 to 17 years Correlation Chart
The statistical analysis conducted on geographies consisting of 319,576,456 people shows a weak positive correlation between the proportion of Czechs and unemployment rate among women with children between the ages 6 and 17 in the United States with a correlation coefficient (R) of 0.292 and weighted average of 8.7%. Similarly, the statistical analysis conducted on geographies consisting of 30,496,305 people shows a weak negative correlation between the proportion of Taiwanese and unemployment rate among women with children between the ages 6 and 17 in the United States with a correlation coefficient (R) of -0.249 and weighted average of 6.5%, a difference of 34.5%.
Unemployment Among Women with Children Ages 6 to 17 years Correlation Summary
| Measurement | Czech | Taiwanese |
| Minimum | 4.6% | 0.40% |
| Maximum | 100.0% | 26.9% |
| Range | 95.4% | 26.5% |
| Mean | 22.1% | 7.2% |
| Median | 10.4% | 6.1% |
| Interquartile 25% (IQ1) | 8.3% | 4.5% |
| Interquartile 75% (IQ3) | 21.6% | 8.4% |
| Interquartile Range (IQR) | 13.3% | 3.9% |
| Standard Deviation (Sample) | 27.9% | 5.5% |
| Standard Deviation (Population) | 27.6% | 5.4% |
Similar Demographics by Unemployment Among Women with Children Ages 6 to 17 years
Demographics Similar to Czechs by Unemployment Among Women with Children Ages 6 to 17 years
In terms of unemployment among women with children ages 6 to 17 years, the demographic groups most similar to Czechs are Immigrants from Northern Africa (8.7%, a difference of 0.010%), Hmong (8.7%, a difference of 0.020%), South African (8.7%, a difference of 0.030%), Immigrants from Morocco (8.7%, a difference of 0.10%), and Immigrants from Lebanon (8.7%, a difference of 0.10%).
| Demographics | Rating | Rank | Unemployment Among Women with Children Ages 6 to 17 years |
| Israelis | 95.9 /100 | #120 | Exceptional 8.7% |
| Immigrants | Denmark | 95.5 /100 | #121 | Exceptional 8.7% |
| Immigrants | Egypt | 95.0 /100 | #122 | Exceptional 8.7% |
| Immigrants | Morocco | 94.9 /100 | #123 | Exceptional 8.7% |
| Immigrants | Lebanon | 94.9 /100 | #124 | Exceptional 8.7% |
| South Africans | 94.6 /100 | #125 | Exceptional 8.7% |
| Immigrants | Northern Africa | 94.4 /100 | #126 | Exceptional 8.7% |
| Czechs | 94.4 /100 | #127 | Exceptional 8.7% |
| Hmong | 94.3 /100 | #128 | Exceptional 8.7% |
| Barbadians | 93.8 /100 | #129 | Exceptional 8.7% |
| Immigrants | Western Asia | 93.1 /100 | #130 | Exceptional 8.7% |
| Slavs | 92.2 /100 | #131 | Exceptional 8.7% |
| Yaqui | 92.2 /100 | #132 | Exceptional 8.7% |
| Egyptians | 91.8 /100 | #133 | Exceptional 8.7% |
| Immigrants | Ireland | 91.0 /100 | #134 | Exceptional 8.7% |
Demographics Similar to Taiwanese by Unemployment Among Women with Children Ages 6 to 17 years
In terms of unemployment among women with children ages 6 to 17 years, the demographic groups most similar to Taiwanese are Fijian (6.6%, a difference of 2.6%), Tongan (6.7%, a difference of 3.8%), Ute (7.0%, a difference of 8.5%), Okinawan (7.0%, a difference of 9.1%), and Tlingit-Haida (7.1%, a difference of 9.7%).
| Demographics | Rating | Rank | Unemployment Among Women with Children Ages 6 to 17 years |
| Taiwanese | 100.0 /100 | #1 | Exceptional 6.5% |
| Fijians | 100.0 /100 | #2 | Exceptional 6.6% |
| Tongans | 100.0 /100 | #3 | Exceptional 6.7% |
| Ute | 100.0 /100 | #4 | Exceptional 7.0% |
| Okinawans | 100.0 /100 | #5 | Exceptional 7.0% |
| Tlingit-Haida | 100.0 /100 | #6 | Exceptional 7.1% |
| Soviet Union | 100.0 /100 | #7 | Exceptional 7.1% |
| Immigrants | Hong Kong | 100.0 /100 | #8 | Exceptional 7.2% |
| Assyrians/Chaldeans/Syriacs | 100.0 /100 | #9 | Exceptional 7.2% |
| Immigrants | Fiji | 100.0 /100 | #10 | Exceptional 7.3% |
| Immigrants | Taiwan | 100.0 /100 | #11 | Exceptional 7.3% |
| Bangladeshis | 100.0 /100 | #12 | Exceptional 7.4% |
| Indonesians | 100.0 /100 | #13 | Exceptional 7.4% |
| Sudanese | 100.0 /100 | #14 | Exceptional 7.4% |
| Puget Sound Salish | 100.0 /100 | #15 | Exceptional 7.5% |