Creek vs Zimbabwean Unemployment Among Ages 55 to 59 years
COMPARE
Creek
Zimbabwean
Unemployment Among Ages 55 to 59 years
Unemployment Among Ages 55 to 59 years Comparison
Creek
Zimbabweans
4.9%
UNEMPLOYMENT AMONG AGES 55 TO 59 YEARS
12.9/ 100
METRIC RATING
210th/ 347
METRIC RANK
4.2%
UNEMPLOYMENT AMONG AGES 55 TO 59 YEARS
100.0/ 100
METRIC RATING
7th/ 347
METRIC RANK
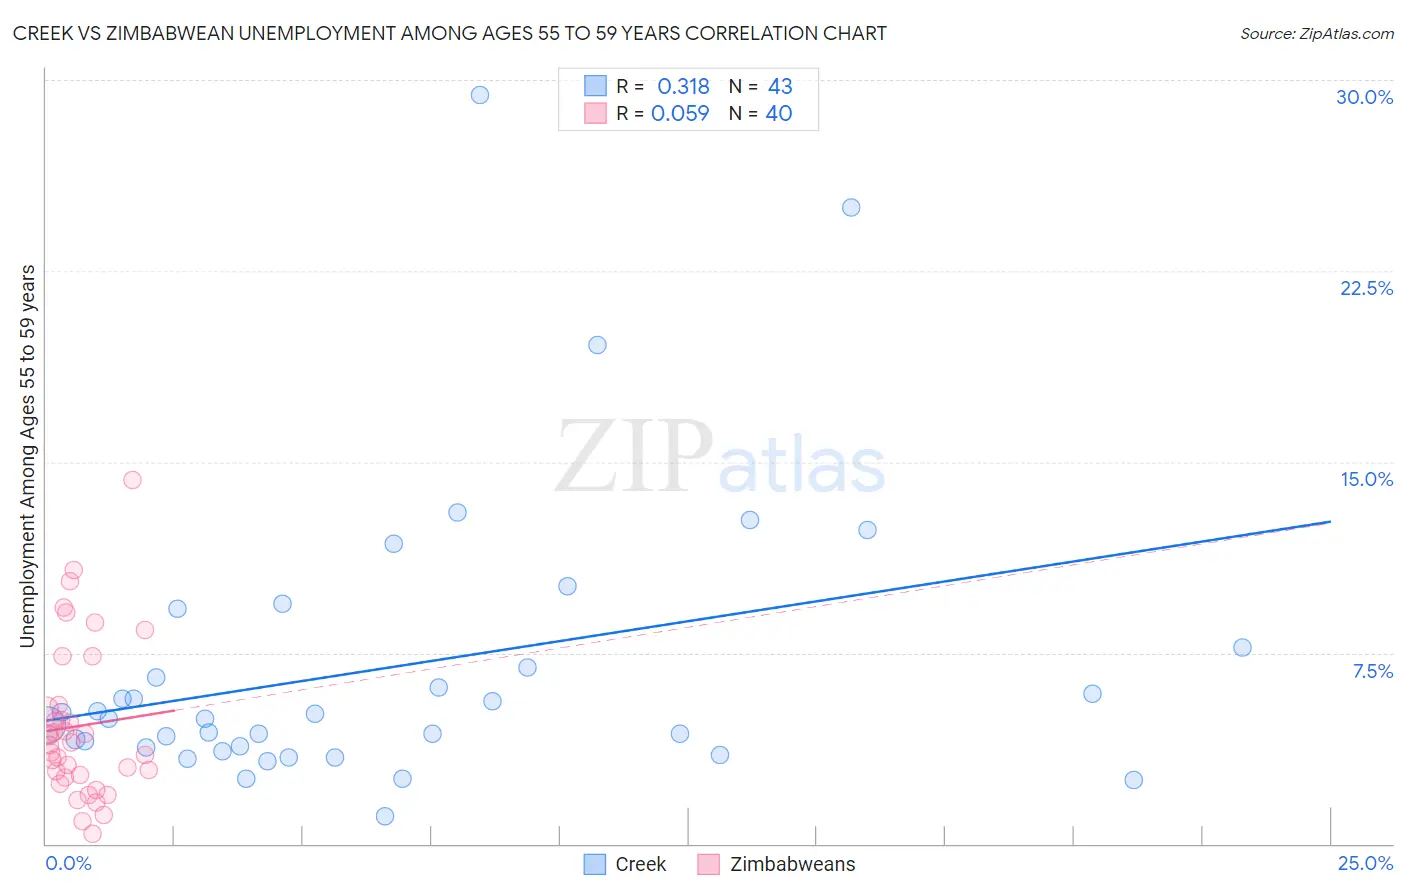
Creek vs Zimbabwean Unemployment Among Ages 55 to 59 years Correlation Chart
The statistical analysis conducted on geographies consisting of 169,123,229 people shows a mild positive correlation between the proportion of Creek and unemployment rate among population between the ages 55 and 59 in the United States with a correlation coefficient (R) of 0.318 and weighted average of 4.9%. Similarly, the statistical analysis conducted on geographies consisting of 68,276,409 people shows a slight positive correlation between the proportion of Zimbabweans and unemployment rate among population between the ages 55 and 59 in the United States with a correlation coefficient (R) of 0.059 and weighted average of 4.2%, a difference of 16.1%.
Unemployment Among Ages 55 to 59 years Correlation Summary
| Measurement | Creek | Zimbabwean |
| Minimum | 1.1% | 0.40% |
| Maximum | 29.4% | 14.3% |
| Range | 28.3% | 13.9% |
| Mean | 7.0% | 4.6% |
| Median | 4.9% | 3.9% |
| Interquartile 25% (IQ1) | 3.8% | 2.7% |
| Interquartile 75% (IQ3) | 7.7% | 5.4% |
| Interquartile Range (IQR) | 3.9% | 2.7% |
| Standard Deviation (Sample) | 5.8% | 3.1% |
| Standard Deviation (Population) | 5.7% | 3.0% |
Similar Demographics by Unemployment Among Ages 55 to 59 years
Demographics Similar to Creek by Unemployment Among Ages 55 to 59 years
In terms of unemployment among ages 55 to 59 years, the demographic groups most similar to Creek are Hawaiian (4.9%, a difference of 0.010%), Immigrants from Haiti (4.9%, a difference of 0.030%), Immigrants from Kazakhstan (4.9%, a difference of 0.090%), Immigrants from Belarus (4.9%, a difference of 0.10%), and Immigrants from Australia (4.9%, a difference of 0.10%).
| Demographics | Rating | Rank | Unemployment Among Ages 55 to 59 years |
| Guamanians/Chamorros | 20.8 /100 | #203 | Fair 4.9% |
| Immigrants | Latvia | 18.5 /100 | #204 | Poor 4.9% |
| Haitians | 18.1 /100 | #205 | Poor 4.9% |
| Immigrants | Belarus | 14.1 /100 | #206 | Poor 4.9% |
| Immigrants | Australia | 14.1 /100 | #207 | Poor 4.9% |
| Immigrants | Kazakhstan | 14.0 /100 | #208 | Poor 4.9% |
| Immigrants | Haiti | 13.3 /100 | #209 | Poor 4.9% |
| Creek | 12.9 /100 | #210 | Poor 4.9% |
| Hawaiians | 12.8 /100 | #211 | Poor 4.9% |
| Immigrants | Nonimmigrants | 11.2 /100 | #212 | Poor 4.9% |
| Bermudans | 11.0 /100 | #213 | Poor 4.9% |
| Immigrants | Denmark | 10.3 /100 | #214 | Poor 4.9% |
| Syrians | 8.6 /100 | #215 | Tragic 4.9% |
| Spanish Americans | 8.1 /100 | #216 | Tragic 4.9% |
| Immigrants | Brazil | 8.1 /100 | #217 | Tragic 4.9% |
Demographics Similar to Zimbabweans by Unemployment Among Ages 55 to 59 years
In terms of unemployment among ages 55 to 59 years, the demographic groups most similar to Zimbabweans are Bolivian (4.2%, a difference of 0.12%), Cuban (4.2%, a difference of 0.23%), Norwegian (4.2%, a difference of 0.57%), Immigrants from Bolivia (4.2%, a difference of 1.1%), and Tongan (4.3%, a difference of 1.2%).
| Demographics | Rating | Rank | Unemployment Among Ages 55 to 59 years |
| Fijians | 100.0 /100 | #1 | Exceptional 4.1% |
| Immigrants | Cuba | 100.0 /100 | #2 | Exceptional 4.1% |
| Immigrants | Venezuela | 100.0 /100 | #3 | Exceptional 4.1% |
| Venezuelans | 100.0 /100 | #4 | Exceptional 4.2% |
| Immigrants | Bolivia | 100.0 /100 | #5 | Exceptional 4.2% |
| Norwegians | 100.0 /100 | #6 | Exceptional 4.2% |
| Zimbabweans | 100.0 /100 | #7 | Exceptional 4.2% |
| Bolivians | 100.0 /100 | #8 | Exceptional 4.2% |
| Cubans | 100.0 /100 | #9 | Exceptional 4.2% |
| Tongans | 100.0 /100 | #10 | Exceptional 4.3% |
| Immigrants | Congo | 100.0 /100 | #11 | Exceptional 4.3% |
| Danes | 100.0 /100 | #12 | Exceptional 4.3% |
| Indonesians | 100.0 /100 | #13 | Exceptional 4.3% |
| Immigrants | India | 100.0 /100 | #14 | Exceptional 4.3% |
| Bulgarians | 100.0 /100 | #15 | Exceptional 4.3% |