Argentinean vs Zimbabwean Unemployment Among Ages 55 to 59 years
COMPARE
Argentinean
Zimbabwean
Unemployment Among Ages 55 to 59 years
Unemployment Among Ages 55 to 59 years Comparison
Argentineans
Zimbabweans
4.6%
UNEMPLOYMENT AMONG AGES 55 TO 59 YEARS
99.1/ 100
METRIC RATING
64th/ 347
METRIC RANK
4.2%
UNEMPLOYMENT AMONG AGES 55 TO 59 YEARS
100.0/ 100
METRIC RATING
7th/ 347
METRIC RANK
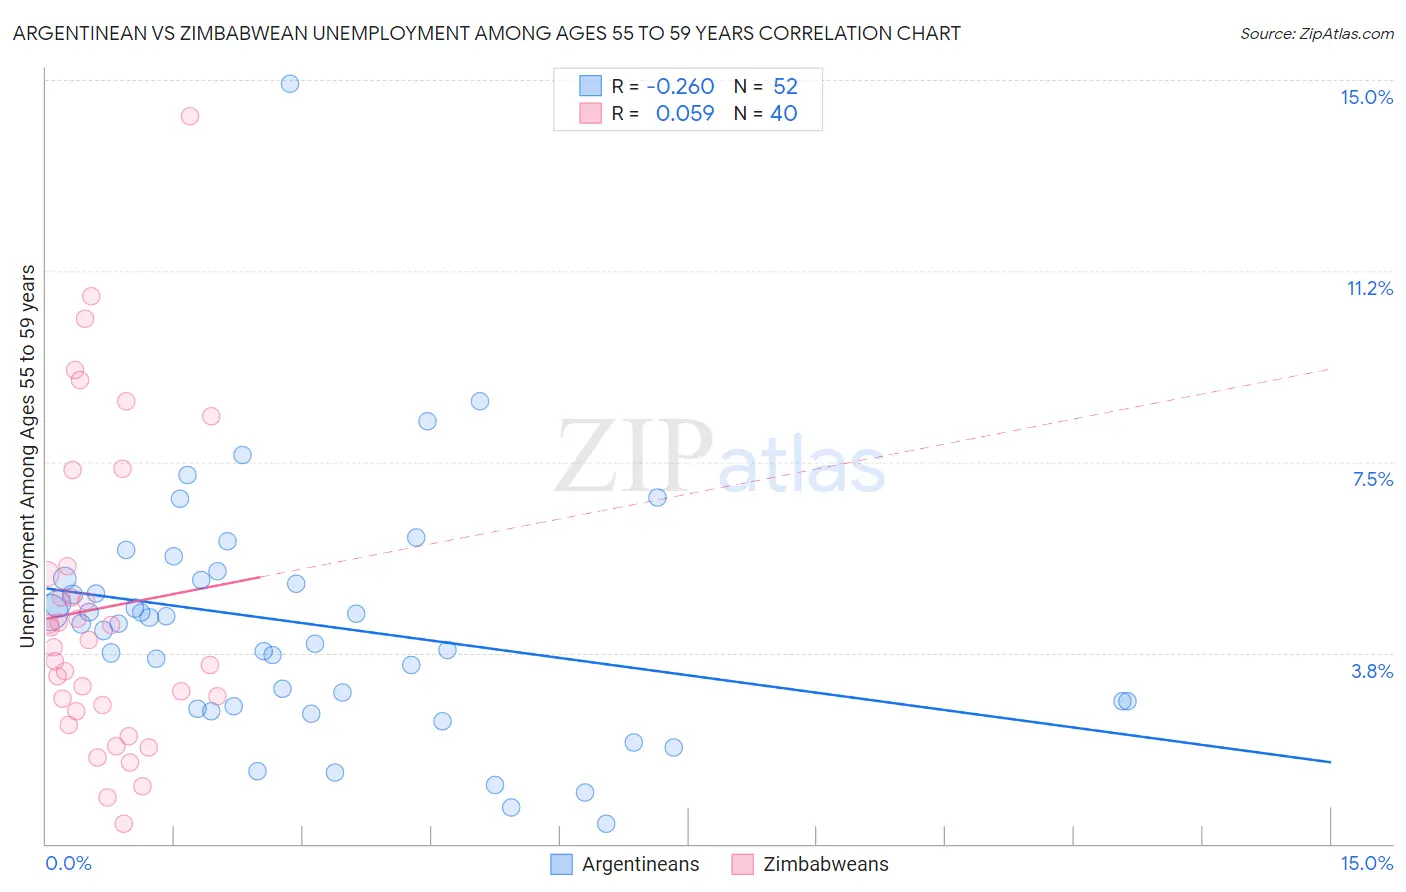
Argentinean vs Zimbabwean Unemployment Among Ages 55 to 59 years Correlation Chart
The statistical analysis conducted on geographies consisting of 283,623,143 people shows a weak negative correlation between the proportion of Argentineans and unemployment rate among population between the ages 55 and 59 in the United States with a correlation coefficient (R) of -0.260 and weighted average of 4.6%. Similarly, the statistical analysis conducted on geographies consisting of 68,276,409 people shows a slight positive correlation between the proportion of Zimbabweans and unemployment rate among population between the ages 55 and 59 in the United States with a correlation coefficient (R) of 0.059 and weighted average of 4.2%, a difference of 8.4%.
Unemployment Among Ages 55 to 59 years Correlation Summary
| Measurement | Argentinean | Zimbabwean |
| Minimum | 0.40% | 0.40% |
| Maximum | 14.9% | 14.3% |
| Range | 14.5% | 13.9% |
| Mean | 4.3% | 4.6% |
| Median | 4.3% | 3.9% |
| Interquartile 25% (IQ1) | 2.8% | 2.7% |
| Interquartile 75% (IQ3) | 5.2% | 5.4% |
| Interquartile Range (IQR) | 2.4% | 2.7% |
| Standard Deviation (Sample) | 2.4% | 3.1% |
| Standard Deviation (Population) | 2.4% | 3.0% |
Similar Demographics by Unemployment Among Ages 55 to 59 years
Demographics Similar to Argentineans by Unemployment Among Ages 55 to 59 years
In terms of unemployment among ages 55 to 59 years, the demographic groups most similar to Argentineans are Sudanese (4.6%, a difference of 0.010%), Mongolian (4.6%, a difference of 0.14%), Immigrants from South Central Asia (4.6%, a difference of 0.18%), Ugandan (4.6%, a difference of 0.18%), and Immigrants from Micronesia (4.6%, a difference of 0.19%).
| Demographics | Rating | Rank | Unemployment Among Ages 55 to 59 years |
| Northern Europeans | 99.6 /100 | #57 | Exceptional 4.5% |
| Okinawans | 99.6 /100 | #58 | Exceptional 4.5% |
| Immigrants | Uganda | 99.5 /100 | #59 | Exceptional 4.6% |
| Dutch | 99.5 /100 | #60 | Exceptional 4.6% |
| Immigrants | Argentina | 99.5 /100 | #61 | Exceptional 4.6% |
| Slovenes | 99.3 /100 | #62 | Exceptional 4.6% |
| Immigrants | South Central Asia | 99.3 /100 | #63 | Exceptional 4.6% |
| Argentineans | 99.1 /100 | #64 | Exceptional 4.6% |
| Sudanese | 99.1 /100 | #65 | Exceptional 4.6% |
| Mongolians | 99.0 /100 | #66 | Exceptional 4.6% |
| Ugandans | 99.0 /100 | #67 | Exceptional 4.6% |
| Immigrants | Micronesia | 99.0 /100 | #68 | Exceptional 4.6% |
| Czechoslovakians | 99.0 /100 | #69 | Exceptional 4.6% |
| Filipinos | 98.8 /100 | #70 | Exceptional 4.6% |
| Immigrants | Jordan | 98.7 /100 | #71 | Exceptional 4.6% |
Demographics Similar to Zimbabweans by Unemployment Among Ages 55 to 59 years
In terms of unemployment among ages 55 to 59 years, the demographic groups most similar to Zimbabweans are Bolivian (4.2%, a difference of 0.12%), Cuban (4.2%, a difference of 0.23%), Norwegian (4.2%, a difference of 0.57%), Immigrants from Bolivia (4.2%, a difference of 1.1%), and Tongan (4.3%, a difference of 1.2%).
| Demographics | Rating | Rank | Unemployment Among Ages 55 to 59 years |
| Fijians | 100.0 /100 | #1 | Exceptional 4.1% |
| Immigrants | Cuba | 100.0 /100 | #2 | Exceptional 4.1% |
| Immigrants | Venezuela | 100.0 /100 | #3 | Exceptional 4.1% |
| Venezuelans | 100.0 /100 | #4 | Exceptional 4.2% |
| Immigrants | Bolivia | 100.0 /100 | #5 | Exceptional 4.2% |
| Norwegians | 100.0 /100 | #6 | Exceptional 4.2% |
| Zimbabweans | 100.0 /100 | #7 | Exceptional 4.2% |
| Bolivians | 100.0 /100 | #8 | Exceptional 4.2% |
| Cubans | 100.0 /100 | #9 | Exceptional 4.2% |
| Tongans | 100.0 /100 | #10 | Exceptional 4.3% |
| Immigrants | Congo | 100.0 /100 | #11 | Exceptional 4.3% |
| Danes | 100.0 /100 | #12 | Exceptional 4.3% |
| Indonesians | 100.0 /100 | #13 | Exceptional 4.3% |
| Immigrants | India | 100.0 /100 | #14 | Exceptional 4.3% |
| Bulgarians | 100.0 /100 | #15 | Exceptional 4.3% |