Colville vs Immigrants from Honduras Unemployment Among Ages 35 to 44 years
COMPARE
Colville
Immigrants from Honduras
Unemployment Among Ages 35 to 44 years
Unemployment Among Ages 35 to 44 years Comparison
Colville
Immigrants from Honduras
6.2%
UNEMPLOYMENT AMONG AGES 35 TO 44 YEARS
0.0/ 100
METRIC RATING
318th/ 347
METRIC RANK
5.1%
UNEMPLOYMENT AMONG AGES 35 TO 44 YEARS
0.6/ 100
METRIC RATING
241st/ 347
METRIC RANK
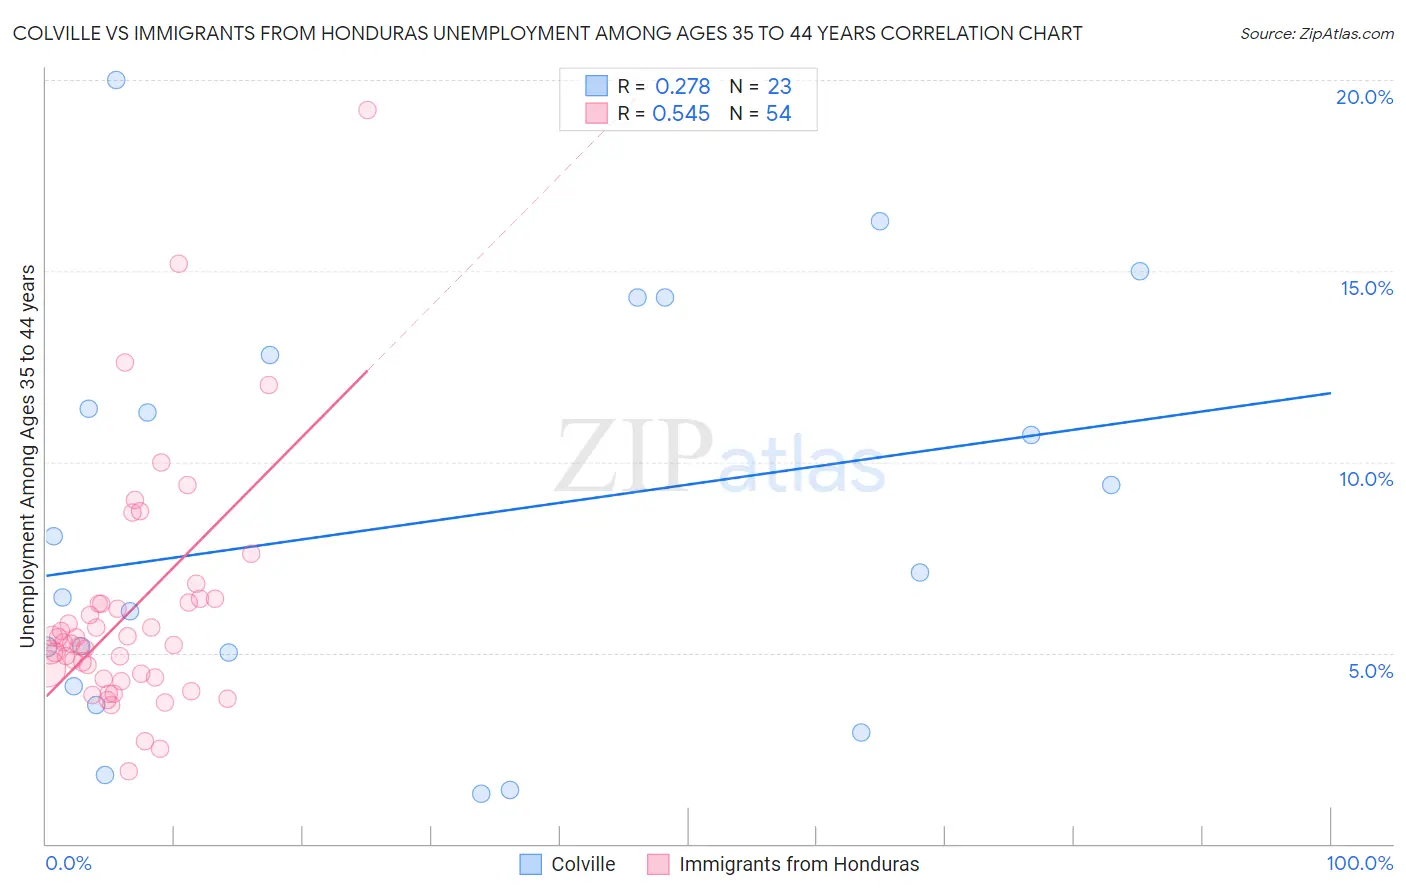
Colville vs Immigrants from Honduras Unemployment Among Ages 35 to 44 years Correlation Chart
The statistical analysis conducted on geographies consisting of 34,478,575 people shows a weak positive correlation between the proportion of Colville and unemployment rate among population between the ages 35 and 44 in the United States with a correlation coefficient (R) of 0.278 and weighted average of 6.2%. Similarly, the statistical analysis conducted on geographies consisting of 317,592,724 people shows a substantial positive correlation between the proportion of Immigrants from Honduras and unemployment rate among population between the ages 35 and 44 in the United States with a correlation coefficient (R) of 0.545 and weighted average of 5.1%, a difference of 21.0%.
Unemployment Among Ages 35 to 44 years Correlation Summary
| Measurement | Colville | Immigrants from Honduras |
| Minimum | 1.3% | 1.9% |
| Maximum | 20.0% | 19.2% |
| Range | 18.7% | 17.3% |
| Mean | 8.4% | 6.1% |
| Median | 7.1% | 5.3% |
| Interquartile 25% (IQ1) | 4.1% | 4.4% |
| Interquartile 75% (IQ3) | 12.8% | 6.3% |
| Interquartile Range (IQR) | 8.7% | 1.9% |
| Standard Deviation (Sample) | 5.3% | 3.1% |
| Standard Deviation (Population) | 5.2% | 3.0% |
Similar Demographics by Unemployment Among Ages 35 to 44 years
Demographics Similar to Colville by Unemployment Among Ages 35 to 44 years
In terms of unemployment among ages 35 to 44 years, the demographic groups most similar to Colville are Immigrants from Grenada (6.2%, a difference of 0.25%), Immigrants from St. Vincent and the Grenadines (6.2%, a difference of 0.41%), Immigrants from Armenia (6.2%, a difference of 0.49%), Chippewa (6.2%, a difference of 0.55%), and Tsimshian (6.2%, a difference of 0.60%).
| Demographics | Rating | Rank | Unemployment Among Ages 35 to 44 years |
| Marshallese | 0.0 /100 | #311 | Tragic 5.9% |
| Immigrants | Guyana | 0.0 /100 | #312 | Tragic 6.0% |
| British West Indians | 0.0 /100 | #313 | Tragic 6.0% |
| Immigrants | Dominica | 0.0 /100 | #314 | Tragic 6.0% |
| Blacks/African Americans | 0.0 /100 | #315 | Tragic 6.1% |
| Tsimshian | 0.0 /100 | #316 | Tragic 6.2% |
| Immigrants | St. Vincent and the Grenadines | 0.0 /100 | #317 | Tragic 6.2% |
| Colville | 0.0 /100 | #318 | Tragic 6.2% |
| Immigrants | Grenada | 0.0 /100 | #319 | Tragic 6.2% |
| Immigrants | Armenia | 0.0 /100 | #320 | Tragic 6.2% |
| Chippewa | 0.0 /100 | #321 | Tragic 6.2% |
| Immigrants | Dominican Republic | 0.0 /100 | #322 | Tragic 6.4% |
| Dominicans | 0.0 /100 | #323 | Tragic 6.4% |
| Menominee | 0.0 /100 | #324 | Tragic 6.5% |
| Immigrants | Yemen | 0.0 /100 | #325 | Tragic 6.6% |
Demographics Similar to Immigrants from Honduras by Unemployment Among Ages 35 to 44 years
In terms of unemployment among ages 35 to 44 years, the demographic groups most similar to Immigrants from Honduras are Somali (5.1%, a difference of 0.18%), Nigerian (5.1%, a difference of 0.31%), Honduran (5.1%, a difference of 0.37%), Delaware (5.1%, a difference of 0.37%), and Salvadoran (5.1%, a difference of 0.49%).
| Demographics | Rating | Rank | Unemployment Among Ages 35 to 44 years |
| Portuguese | 1.1 /100 | #234 | Tragic 5.1% |
| Guamanians/Chamorros | 0.9 /100 | #235 | Tragic 5.1% |
| Central Americans | 0.8 /100 | #236 | Tragic 5.1% |
| Kiowa | 0.8 /100 | #237 | Tragic 5.1% |
| Hondurans | 0.7 /100 | #238 | Tragic 5.1% |
| Nigerians | 0.7 /100 | #239 | Tragic 5.1% |
| Somalis | 0.7 /100 | #240 | Tragic 5.1% |
| Immigrants | Honduras | 0.6 /100 | #241 | Tragic 5.1% |
| Delaware | 0.5 /100 | #242 | Tragic 5.1% |
| Salvadorans | 0.4 /100 | #243 | Tragic 5.1% |
| Guatemalans | 0.4 /100 | #244 | Tragic 5.1% |
| Bahamians | 0.4 /100 | #245 | Tragic 5.2% |
| Immigrants | Guatemala | 0.4 /100 | #246 | Tragic 5.2% |
| Immigrants | Somalia | 0.3 /100 | #247 | Tragic 5.2% |
| Alsatians | 0.2 /100 | #248 | Tragic 5.2% |