Colville vs French Canadian Unemployment Among Ages 35 to 44 years
COMPARE
Colville
French Canadian
Unemployment Among Ages 35 to 44 years
Unemployment Among Ages 35 to 44 years Comparison
Colville
French Canadians
6.2%
UNEMPLOYMENT AMONG AGES 35 TO 44 YEARS
0.0/ 100
METRIC RATING
318th/ 347
METRIC RANK
4.8%
UNEMPLOYMENT AMONG AGES 35 TO 44 YEARS
16.5/ 100
METRIC RATING
208th/ 347
METRIC RANK
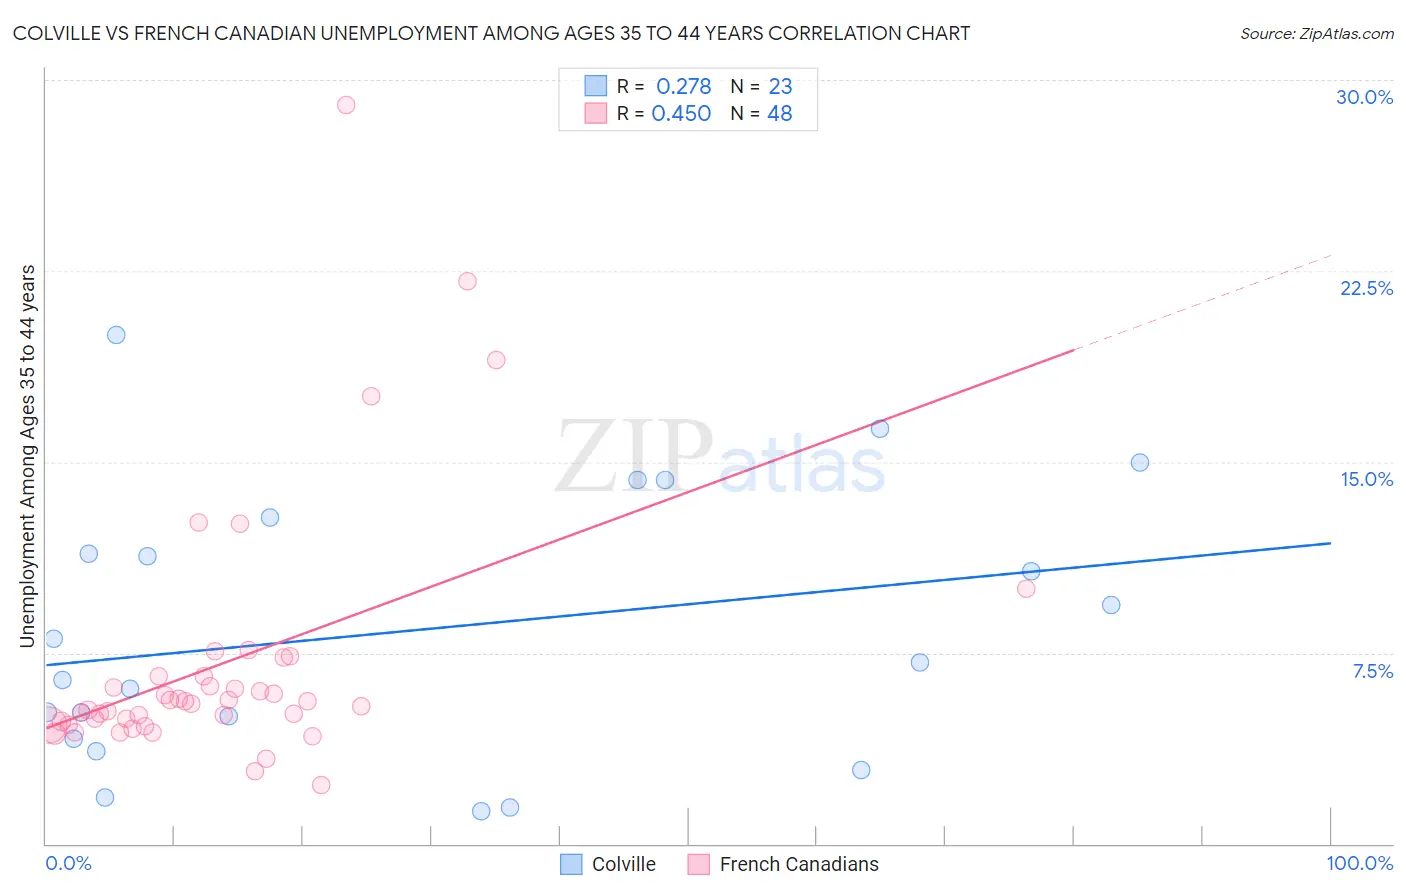
Colville vs French Canadian Unemployment Among Ages 35 to 44 years Correlation Chart
The statistical analysis conducted on geographies consisting of 34,478,575 people shows a weak positive correlation between the proportion of Colville and unemployment rate among population between the ages 35 and 44 in the United States with a correlation coefficient (R) of 0.278 and weighted average of 6.2%. Similarly, the statistical analysis conducted on geographies consisting of 478,615,928 people shows a moderate positive correlation between the proportion of French Canadians and unemployment rate among population between the ages 35 and 44 in the United States with a correlation coefficient (R) of 0.450 and weighted average of 4.8%, a difference of 28.4%.
Unemployment Among Ages 35 to 44 years Correlation Summary
| Measurement | Colville | French Canadian |
| Minimum | 1.3% | 2.3% |
| Maximum | 20.0% | 29.0% |
| Range | 18.7% | 26.7% |
| Mean | 8.4% | 7.1% |
| Median | 7.1% | 5.5% |
| Interquartile 25% (IQ1) | 4.1% | 4.7% |
| Interquartile 75% (IQ3) | 12.8% | 6.6% |
| Interquartile Range (IQR) | 8.7% | 1.8% |
| Standard Deviation (Sample) | 5.3% | 5.1% |
| Standard Deviation (Population) | 5.2% | 5.0% |
Similar Demographics by Unemployment Among Ages 35 to 44 years
Demographics Similar to Colville by Unemployment Among Ages 35 to 44 years
In terms of unemployment among ages 35 to 44 years, the demographic groups most similar to Colville are Immigrants from Grenada (6.2%, a difference of 0.25%), Immigrants from St. Vincent and the Grenadines (6.2%, a difference of 0.41%), Immigrants from Armenia (6.2%, a difference of 0.49%), Chippewa (6.2%, a difference of 0.55%), and Tsimshian (6.2%, a difference of 0.60%).
| Demographics | Rating | Rank | Unemployment Among Ages 35 to 44 years |
| Marshallese | 0.0 /100 | #311 | Tragic 5.9% |
| Immigrants | Guyana | 0.0 /100 | #312 | Tragic 6.0% |
| British West Indians | 0.0 /100 | #313 | Tragic 6.0% |
| Immigrants | Dominica | 0.0 /100 | #314 | Tragic 6.0% |
| Blacks/African Americans | 0.0 /100 | #315 | Tragic 6.1% |
| Tsimshian | 0.0 /100 | #316 | Tragic 6.2% |
| Immigrants | St. Vincent and the Grenadines | 0.0 /100 | #317 | Tragic 6.2% |
| Colville | 0.0 /100 | #318 | Tragic 6.2% |
| Immigrants | Grenada | 0.0 /100 | #319 | Tragic 6.2% |
| Immigrants | Armenia | 0.0 /100 | #320 | Tragic 6.2% |
| Chippewa | 0.0 /100 | #321 | Tragic 6.2% |
| Immigrants | Dominican Republic | 0.0 /100 | #322 | Tragic 6.4% |
| Dominicans | 0.0 /100 | #323 | Tragic 6.4% |
| Menominee | 0.0 /100 | #324 | Tragic 6.5% |
| Immigrants | Yemen | 0.0 /100 | #325 | Tragic 6.6% |
Demographics Similar to French Canadians by Unemployment Among Ages 35 to 44 years
In terms of unemployment among ages 35 to 44 years, the demographic groups most similar to French Canadians are Immigrants from Western Asia (4.8%, a difference of 0.020%), Soviet Union (4.8%, a difference of 0.23%), Spaniard (4.8%, a difference of 0.27%), Immigrants from Philippines (4.8%, a difference of 0.39%), and Uruguayan (4.8%, a difference of 0.41%).
| Demographics | Rating | Rank | Unemployment Among Ages 35 to 44 years |
| Ugandans | 21.4 /100 | #201 | Fair 4.8% |
| Immigrants | Afghanistan | 20.2 /100 | #202 | Fair 4.8% |
| Uruguayans | 20.0 /100 | #203 | Fair 4.8% |
| Immigrants | Philippines | 19.8 /100 | #204 | Poor 4.8% |
| Spaniards | 18.7 /100 | #205 | Poor 4.8% |
| Soviet Union | 18.4 /100 | #206 | Poor 4.8% |
| Immigrants | Western Asia | 16.6 /100 | #207 | Poor 4.8% |
| French Canadians | 16.5 /100 | #208 | Poor 4.8% |
| Immigrants | Uruguay | 11.5 /100 | #209 | Poor 4.9% |
| Immigrants | Cameroon | 11.4 /100 | #210 | Poor 4.9% |
| Immigrants | Nonimmigrants | 9.4 /100 | #211 | Tragic 4.9% |
| Fijians | 8.7 /100 | #212 | Tragic 4.9% |
| Osage | 8.6 /100 | #213 | Tragic 4.9% |
| Immigrants | Africa | 8.2 /100 | #214 | Tragic 4.9% |
| Immigrants | Immigrants | 8.0 /100 | #215 | Tragic 4.9% |