Colombian vs Latvian Unemployment Among Ages 25 to 29 years
COMPARE
Colombian
Latvian
Unemployment Among Ages 25 to 29 years
Unemployment Among Ages 25 to 29 years Comparison
Colombians
Latvians
6.6%
UNEMPLOYMENT AMONG AGES 25 TO 29 YEARS
64.0/ 100
METRIC RATING
154th/ 347
METRIC RANK
6.2%
UNEMPLOYMENT AMONG AGES 25 TO 29 YEARS
99.0/ 100
METRIC RATING
47th/ 347
METRIC RANK
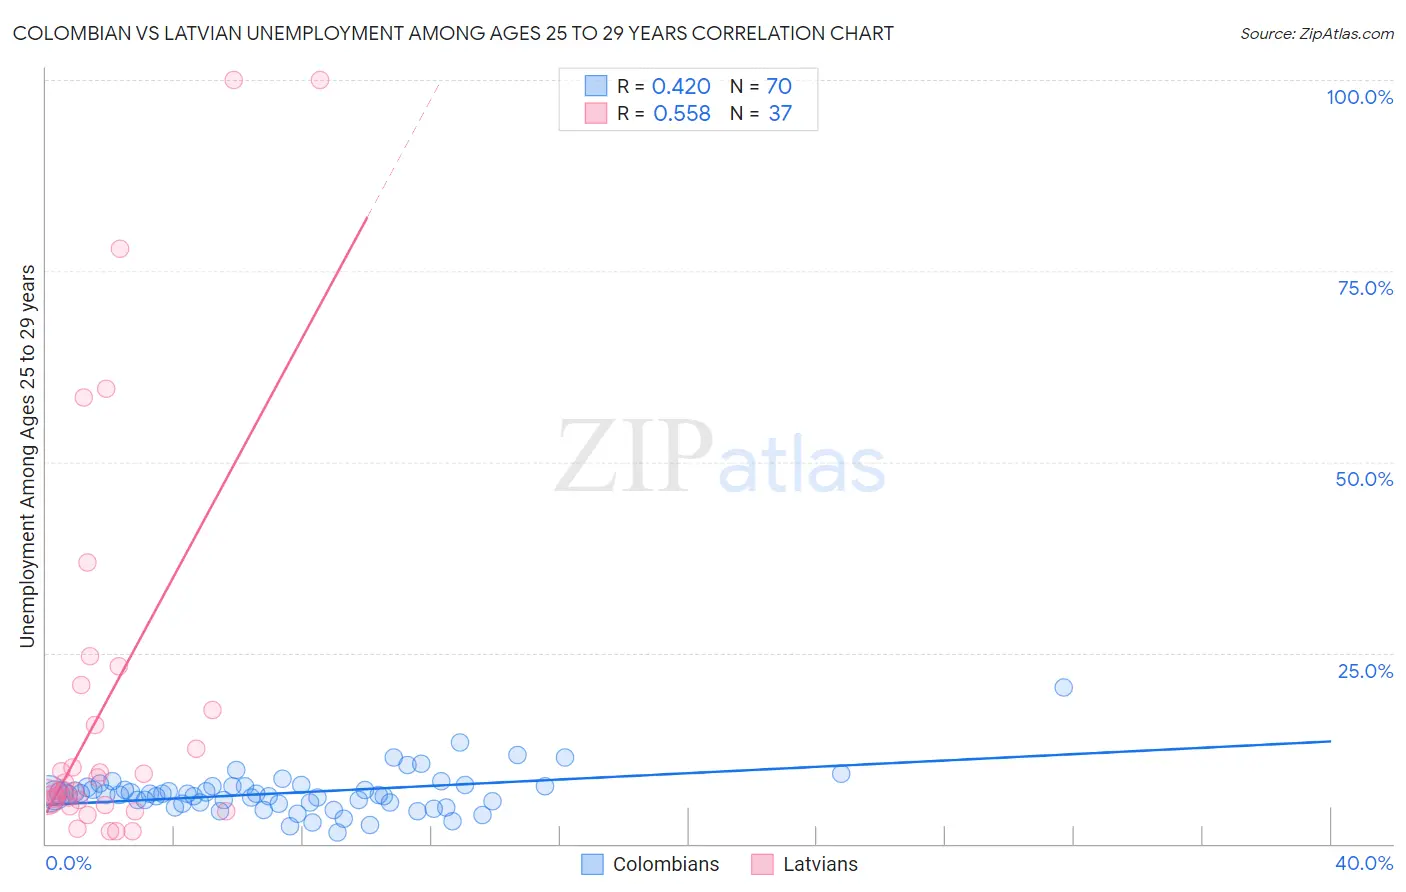
Colombian vs Latvian Unemployment Among Ages 25 to 29 years Correlation Chart
The statistical analysis conducted on geographies consisting of 399,444,526 people shows a moderate positive correlation between the proportion of Colombians and unemployment rate among population between the ages 25 and 29 in the United States with a correlation coefficient (R) of 0.420 and weighted average of 6.6%. Similarly, the statistical analysis conducted on geographies consisting of 212,765,970 people shows a substantial positive correlation between the proportion of Latvians and unemployment rate among population between the ages 25 and 29 in the United States with a correlation coefficient (R) of 0.558 and weighted average of 6.2%, a difference of 6.7%.
Unemployment Among Ages 25 to 29 years Correlation Summary
| Measurement | Colombian | Latvian |
| Minimum | 1.5% | 1.6% |
| Maximum | 20.4% | 100.0% |
| Range | 18.9% | 98.4% |
| Mean | 6.7% | 18.7% |
| Median | 6.5% | 7.0% |
| Interquartile 25% (IQ1) | 5.3% | 5.3% |
| Interquartile 75% (IQ3) | 7.5% | 19.1% |
| Interquartile Range (IQR) | 2.2% | 13.8% |
| Standard Deviation (Sample) | 2.8% | 26.2% |
| Standard Deviation (Population) | 2.7% | 25.8% |
Similar Demographics by Unemployment Among Ages 25 to 29 years
Demographics Similar to Colombians by Unemployment Among Ages 25 to 29 years
In terms of unemployment among ages 25 to 29 years, the demographic groups most similar to Colombians are Immigrants from Latvia (6.6%, a difference of 0.010%), Immigrants from Italy (6.6%, a difference of 0.020%), Immigrants from Laos (6.6%, a difference of 0.030%), South African (6.6%, a difference of 0.030%), and Samoan (6.6%, a difference of 0.040%).
| Demographics | Rating | Rank | Unemployment Among Ages 25 to 29 years |
| Immigrants | Thailand | 68.4 /100 | #147 | Good 6.6% |
| Peruvians | 68.1 /100 | #148 | Good 6.6% |
| Malaysians | 67.1 /100 | #149 | Good 6.6% |
| Finns | 66.9 /100 | #150 | Good 6.6% |
| Ukrainians | 65.5 /100 | #151 | Good 6.6% |
| Samoans | 64.6 /100 | #152 | Good 6.6% |
| Immigrants | Italy | 64.4 /100 | #153 | Good 6.6% |
| Colombians | 64.0 /100 | #154 | Good 6.6% |
| Immigrants | Latvia | 63.9 /100 | #155 | Good 6.6% |
| Immigrants | Laos | 63.5 /100 | #156 | Good 6.6% |
| South Africans | 63.5 /100 | #157 | Good 6.6% |
| Immigrants | Russia | 61.5 /100 | #158 | Good 6.6% |
| Welsh | 61.3 /100 | #159 | Good 6.6% |
| Scottish | 60.7 /100 | #160 | Good 6.6% |
| Paraguayans | 60.4 /100 | #161 | Good 6.6% |
Demographics Similar to Latvians by Unemployment Among Ages 25 to 29 years
In terms of unemployment among ages 25 to 29 years, the demographic groups most similar to Latvians are Immigrants from Australia (6.2%, a difference of 0.010%), Immigrants from Lithuania (6.2%, a difference of 0.020%), German Russian (6.2%, a difference of 0.080%), Venezuelan (6.2%, a difference of 0.10%), and Soviet Union (6.2%, a difference of 0.14%).
| Demographics | Rating | Rank | Unemployment Among Ages 25 to 29 years |
| Immigrants | Kenya | 99.3 /100 | #40 | Exceptional 6.1% |
| Fijians | 99.3 /100 | #41 | Exceptional 6.1% |
| Jordanians | 99.3 /100 | #42 | Exceptional 6.1% |
| Czechs | 99.2 /100 | #43 | Exceptional 6.2% |
| Mongolians | 99.2 /100 | #44 | Exceptional 6.2% |
| Venezuelans | 99.1 /100 | #45 | Exceptional 6.2% |
| Immigrants | Lithuania | 99.0 /100 | #46 | Exceptional 6.2% |
| Latvians | 99.0 /100 | #47 | Exceptional 6.2% |
| Immigrants | Australia | 99.0 /100 | #48 | Exceptional 6.2% |
| German Russians | 99.0 /100 | #49 | Exceptional 6.2% |
| Soviet Union | 98.9 /100 | #50 | Exceptional 6.2% |
| Burmese | 98.9 /100 | #51 | Exceptional 6.2% |
| Immigrants | Turkey | 98.9 /100 | #52 | Exceptional 6.2% |
| Turks | 98.8 /100 | #53 | Exceptional 6.2% |
| Swedes | 98.8 /100 | #54 | Exceptional 6.2% |