Colombian vs Immigrants from Laos Unemployment Among Ages 25 to 29 years
COMPARE
Colombian
Immigrants from Laos
Unemployment Among Ages 25 to 29 years
Unemployment Among Ages 25 to 29 years Comparison
Colombians
Immigrants from Laos
6.6%
UNEMPLOYMENT AMONG AGES 25 TO 29 YEARS
64.0/ 100
METRIC RATING
154th/ 347
METRIC RANK
6.6%
UNEMPLOYMENT AMONG AGES 25 TO 29 YEARS
63.5/ 100
METRIC RATING
156th/ 347
METRIC RANK
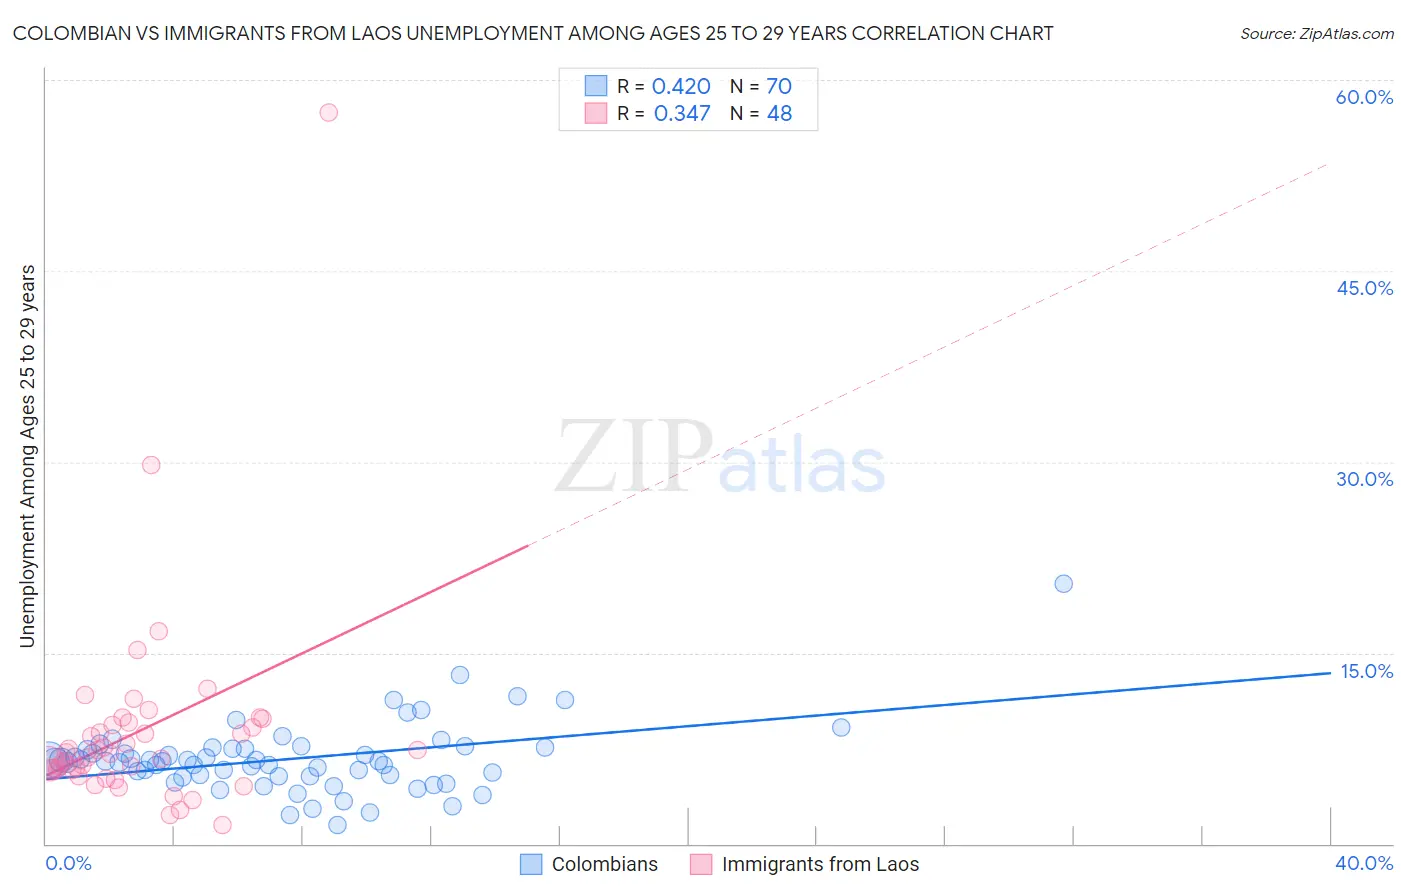
Colombian vs Immigrants from Laos Unemployment Among Ages 25 to 29 years Correlation Chart
The statistical analysis conducted on geographies consisting of 399,444,526 people shows a moderate positive correlation between the proportion of Colombians and unemployment rate among population between the ages 25 and 29 in the United States with a correlation coefficient (R) of 0.420 and weighted average of 6.6%. Similarly, the statistical analysis conducted on geographies consisting of 196,841,643 people shows a mild positive correlation between the proportion of Immigrants from Laos and unemployment rate among population between the ages 25 and 29 in the United States with a correlation coefficient (R) of 0.347 and weighted average of 6.6%, a difference of 0.030%.
Unemployment Among Ages 25 to 29 years Correlation Summary
| Measurement | Colombian | Immigrants from Laos |
| Minimum | 1.5% | 1.5% |
| Maximum | 20.4% | 57.4% |
| Range | 18.9% | 55.9% |
| Mean | 6.7% | 8.9% |
| Median | 6.5% | 7.1% |
| Interquartile 25% (IQ1) | 5.3% | 5.8% |
| Interquartile 75% (IQ3) | 7.5% | 9.4% |
| Interquartile Range (IQR) | 2.2% | 3.6% |
| Standard Deviation (Sample) | 2.8% | 8.4% |
| Standard Deviation (Population) | 2.7% | 8.3% |
Demographics Similar to Colombians and Immigrants from Laos by Unemployment Among Ages 25 to 29 years
In terms of unemployment among ages 25 to 29 years, the demographic groups most similar to Colombians are Immigrants from Latvia (6.6%, a difference of 0.010%), Immigrants from Italy (6.6%, a difference of 0.020%), South African (6.6%, a difference of 0.030%), Samoan (6.6%, a difference of 0.040%), and Ukrainian (6.6%, a difference of 0.10%). Similarly, the demographic groups most similar to Immigrants from Laos are South African (6.6%, a difference of 0.0%), Immigrants from Latvia (6.6%, a difference of 0.020%), Immigrants from Italy (6.6%, a difference of 0.050%), Samoan (6.6%, a difference of 0.070%), and Ukrainian (6.6%, a difference of 0.13%).
| Demographics | Rating | Rank | Unemployment Among Ages 25 to 29 years |
| Nicaraguans | 70.2 /100 | #145 | Good 6.6% |
| Romanians | 69.5 /100 | #146 | Good 6.6% |
| Immigrants | Thailand | 68.4 /100 | #147 | Good 6.6% |
| Peruvians | 68.1 /100 | #148 | Good 6.6% |
| Malaysians | 67.1 /100 | #149 | Good 6.6% |
| Finns | 66.9 /100 | #150 | Good 6.6% |
| Ukrainians | 65.5 /100 | #151 | Good 6.6% |
| Samoans | 64.6 /100 | #152 | Good 6.6% |
| Immigrants | Italy | 64.4 /100 | #153 | Good 6.6% |
| Colombians | 64.0 /100 | #154 | Good 6.6% |
| Immigrants | Latvia | 63.9 /100 | #155 | Good 6.6% |
| Immigrants | Laos | 63.5 /100 | #156 | Good 6.6% |
| South Africans | 63.5 /100 | #157 | Good 6.6% |
| Immigrants | Russia | 61.5 /100 | #158 | Good 6.6% |
| Welsh | 61.3 /100 | #159 | Good 6.6% |
| Scottish | 60.7 /100 | #160 | Good 6.6% |
| Paraguayans | 60.4 /100 | #161 | Good 6.6% |
| Immigrants | Czechoslovakia | 60.2 /100 | #162 | Good 6.6% |
| Immigrants | Middle Africa | 59.4 /100 | #163 | Average 6.6% |
| Greeks | 58.5 /100 | #164 | Average 6.6% |
| English | 58.0 /100 | #165 | Average 6.6% |