Colombian vs Immigrants from Micronesia Unemployment Among Ages 35 to 44 years
COMPARE
Colombian
Immigrants from Micronesia
Unemployment Among Ages 35 to 44 years
Unemployment Among Ages 35 to 44 years Comparison
Colombians
Immigrants from Micronesia
4.6%
UNEMPLOYMENT AMONG AGES 35 TO 44 YEARS
80.8/ 100
METRIC RATING
132nd/ 347
METRIC RANK
5.5%
UNEMPLOYMENT AMONG AGES 35 TO 44 YEARS
0.0/ 100
METRIC RATING
286th/ 347
METRIC RANK
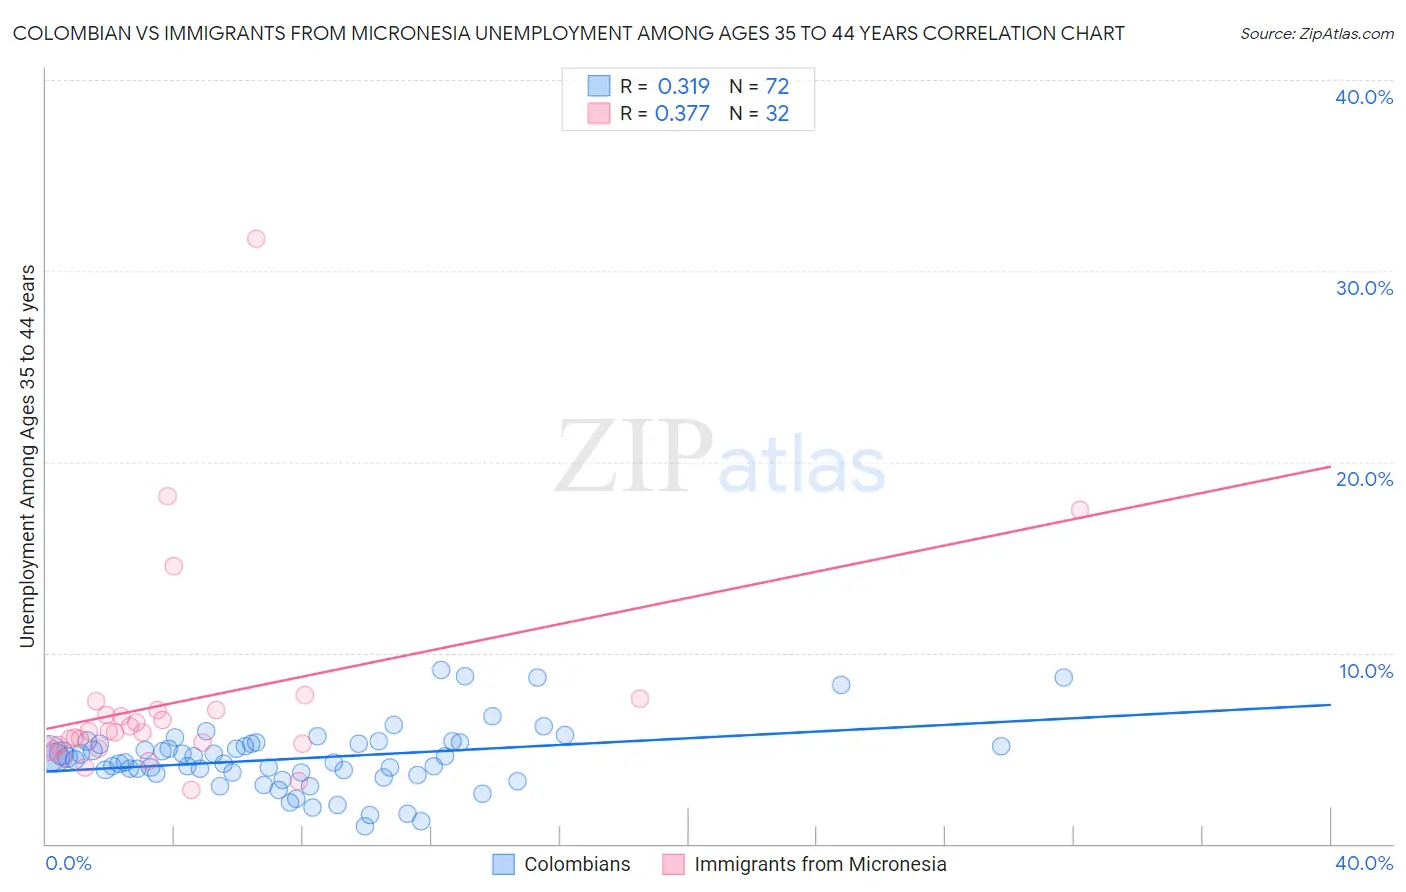
Colombian vs Immigrants from Micronesia Unemployment Among Ages 35 to 44 years Correlation Chart
The statistical analysis conducted on geographies consisting of 410,367,919 people shows a mild positive correlation between the proportion of Colombians and unemployment rate among population between the ages 35 and 44 in the United States with a correlation coefficient (R) of 0.319 and weighted average of 4.6%. Similarly, the statistical analysis conducted on geographies consisting of 61,225,448 people shows a mild positive correlation between the proportion of Immigrants from Micronesia and unemployment rate among population between the ages 35 and 44 in the United States with a correlation coefficient (R) of 0.377 and weighted average of 5.5%, a difference of 20.2%.
Unemployment Among Ages 35 to 44 years Correlation Summary
| Measurement | Colombian | Immigrants from Micronesia |
| Minimum | 0.90% | 2.8% |
| Maximum | 9.1% | 31.7% |
| Range | 8.2% | 28.9% |
| Mean | 4.5% | 7.5% |
| Median | 4.4% | 5.9% |
| Interquartile 25% (IQ1) | 3.7% | 5.1% |
| Interquartile 75% (IQ3) | 5.3% | 7.0% |
| Interquartile Range (IQR) | 1.6% | 1.9% |
| Standard Deviation (Sample) | 1.7% | 5.6% |
| Standard Deviation (Population) | 1.7% | 5.5% |
Similar Demographics by Unemployment Among Ages 35 to 44 years
Demographics Similar to Colombians by Unemployment Among Ages 35 to 44 years
In terms of unemployment among ages 35 to 44 years, the demographic groups most similar to Colombians are Syrian (4.6%, a difference of 0.020%), Laotian (4.6%, a difference of 0.080%), Immigrants from Europe (4.6%, a difference of 0.16%), Scotch-Irish (4.6%, a difference of 0.17%), and Immigrants from Iraq (4.6%, a difference of 0.21%).
| Demographics | Rating | Rank | Unemployment Among Ages 35 to 44 years |
| Immigrants | Northern Africa | 86.1 /100 | #125 | Excellent 4.5% |
| Immigrants | Austria | 84.7 /100 | #126 | Excellent 4.5% |
| Immigrants | Ethiopia | 84.7 /100 | #127 | Excellent 4.5% |
| Czechoslovakians | 83.4 /100 | #128 | Excellent 4.6% |
| Immigrants | Croatia | 83.1 /100 | #129 | Excellent 4.6% |
| Immigrants | Eritrea | 82.8 /100 | #130 | Excellent 4.6% |
| Immigrants | Colombia | 82.6 /100 | #131 | Excellent 4.6% |
| Colombians | 80.8 /100 | #132 | Excellent 4.6% |
| Syrians | 80.7 /100 | #133 | Excellent 4.6% |
| Laotians | 80.1 /100 | #134 | Excellent 4.6% |
| Immigrants | Europe | 79.4 /100 | #135 | Good 4.6% |
| Scotch-Irish | 79.3 /100 | #136 | Good 4.6% |
| Immigrants | Iraq | 78.9 /100 | #137 | Good 4.6% |
| Immigrants | Norway | 77.5 /100 | #138 | Good 4.6% |
| Immigrants | Hungary | 76.3 /100 | #139 | Good 4.6% |
Demographics Similar to Immigrants from Micronesia by Unemployment Among Ages 35 to 44 years
In terms of unemployment among ages 35 to 44 years, the demographic groups most similar to Immigrants from Micronesia are Hispanic or Latino (5.5%, a difference of 0.12%), French American Indian (5.5%, a difference of 0.12%), Haitian (5.5%, a difference of 0.28%), Cree (5.5%, a difference of 0.28%), and Spanish American Indian (5.5%, a difference of 0.62%).
| Demographics | Rating | Rank | Unemployment Among Ages 35 to 44 years |
| Immigrants | Senegal | 0.0 /100 | #279 | Tragic 5.4% |
| Ecuadorians | 0.0 /100 | #280 | Tragic 5.4% |
| Immigrants | Portugal | 0.0 /100 | #281 | Tragic 5.4% |
| Immigrants | Ghana | 0.0 /100 | #282 | Tragic 5.4% |
| Immigrants | Ecuador | 0.0 /100 | #283 | Tragic 5.4% |
| Haitians | 0.0 /100 | #284 | Tragic 5.5% |
| Hispanics or Latinos | 0.0 /100 | #285 | Tragic 5.5% |
| Immigrants | Micronesia | 0.0 /100 | #286 | Tragic 5.5% |
| French American Indians | 0.0 /100 | #287 | Tragic 5.5% |
| Cree | 0.0 /100 | #288 | Tragic 5.5% |
| Spanish American Indians | 0.0 /100 | #289 | Tragic 5.5% |
| Jamaicans | 0.0 /100 | #290 | Tragic 5.5% |
| Dutch West Indians | 0.0 /100 | #291 | Tragic 5.5% |
| Immigrants | Haiti | 0.0 /100 | #292 | Tragic 5.5% |
| Central American Indians | 0.0 /100 | #293 | Tragic 5.6% |