Colombian vs Asian Unemployment Among Ages 35 to 44 years
COMPARE
Colombian
Asian
Unemployment Among Ages 35 to 44 years
Unemployment Among Ages 35 to 44 years Comparison
Colombians
Asians
4.6%
UNEMPLOYMENT AMONG AGES 35 TO 44 YEARS
80.8/ 100
METRIC RATING
132nd/ 347
METRIC RANK
4.4%
UNEMPLOYMENT AMONG AGES 35 TO 44 YEARS
97.4/ 100
METRIC RATING
54th/ 347
METRIC RANK
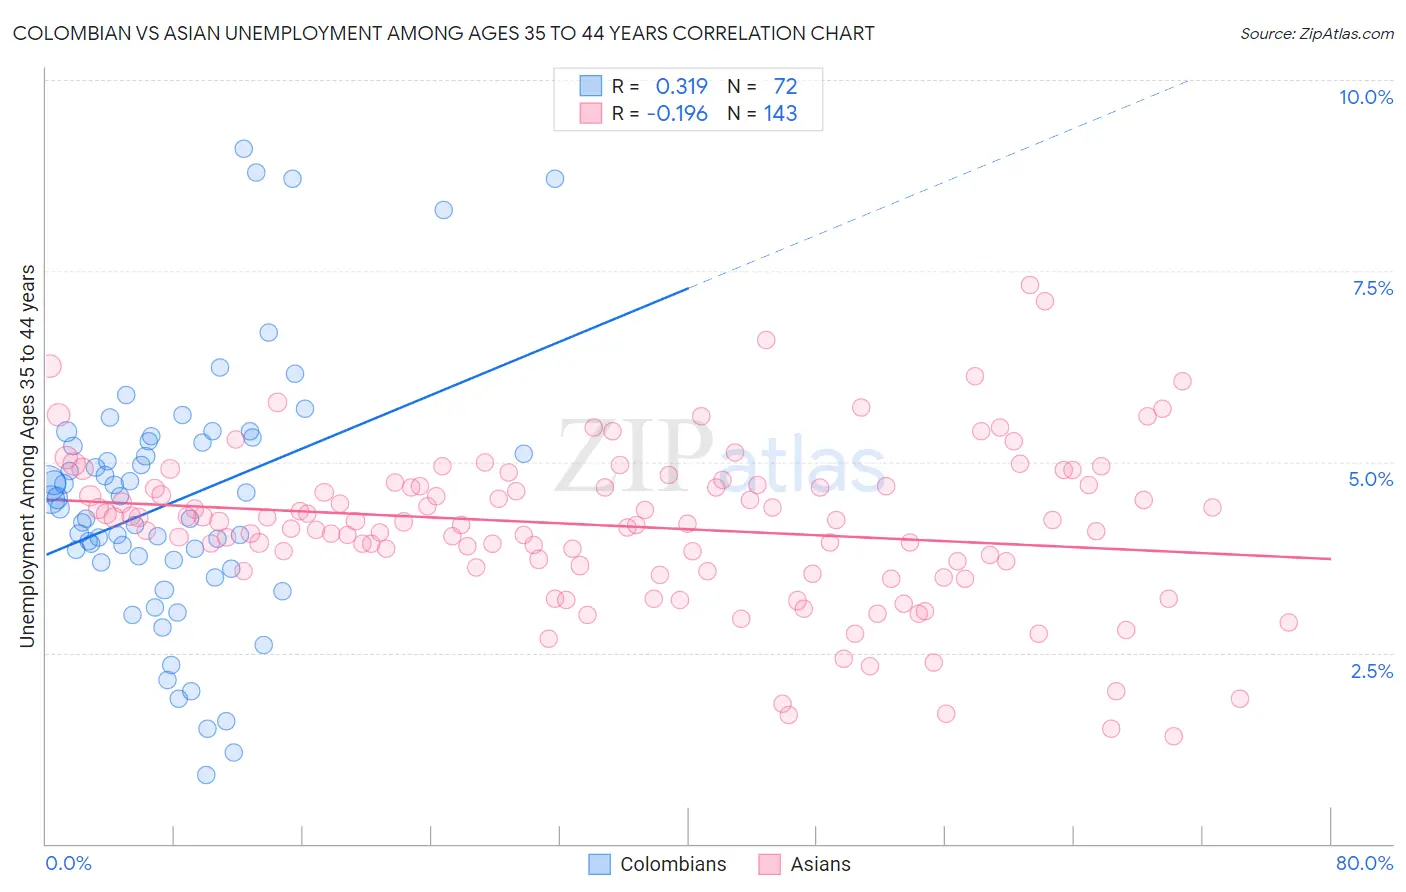
Colombian vs Asian Unemployment Among Ages 35 to 44 years Correlation Chart
The statistical analysis conducted on geographies consisting of 410,367,919 people shows a mild positive correlation between the proportion of Colombians and unemployment rate among population between the ages 35 and 44 in the United States with a correlation coefficient (R) of 0.319 and weighted average of 4.6%. Similarly, the statistical analysis conducted on geographies consisting of 521,064,824 people shows a poor negative correlation between the proportion of Asians and unemployment rate among population between the ages 35 and 44 in the United States with a correlation coefficient (R) of -0.196 and weighted average of 4.4%, a difference of 4.1%.
Unemployment Among Ages 35 to 44 years Correlation Summary
| Measurement | Colombian | Asian |
| Minimum | 0.90% | 1.4% |
| Maximum | 9.1% | 7.3% |
| Range | 8.2% | 5.9% |
| Mean | 4.5% | 4.2% |
| Median | 4.4% | 4.2% |
| Interquartile 25% (IQ1) | 3.7% | 3.6% |
| Interquartile 75% (IQ3) | 5.3% | 4.7% |
| Interquartile Range (IQR) | 1.6% | 1.1% |
| Standard Deviation (Sample) | 1.7% | 1.0% |
| Standard Deviation (Population) | 1.7% | 1.0% |
Similar Demographics by Unemployment Among Ages 35 to 44 years
Demographics Similar to Colombians by Unemployment Among Ages 35 to 44 years
In terms of unemployment among ages 35 to 44 years, the demographic groups most similar to Colombians are Syrian (4.6%, a difference of 0.020%), Laotian (4.6%, a difference of 0.080%), Immigrants from Europe (4.6%, a difference of 0.16%), Scotch-Irish (4.6%, a difference of 0.17%), and Immigrants from Iraq (4.6%, a difference of 0.21%).
| Demographics | Rating | Rank | Unemployment Among Ages 35 to 44 years |
| Immigrants | Northern Africa | 86.1 /100 | #125 | Excellent 4.5% |
| Immigrants | Austria | 84.7 /100 | #126 | Excellent 4.5% |
| Immigrants | Ethiopia | 84.7 /100 | #127 | Excellent 4.5% |
| Czechoslovakians | 83.4 /100 | #128 | Excellent 4.6% |
| Immigrants | Croatia | 83.1 /100 | #129 | Excellent 4.6% |
| Immigrants | Eritrea | 82.8 /100 | #130 | Excellent 4.6% |
| Immigrants | Colombia | 82.6 /100 | #131 | Excellent 4.6% |
| Colombians | 80.8 /100 | #132 | Excellent 4.6% |
| Syrians | 80.7 /100 | #133 | Excellent 4.6% |
| Laotians | 80.1 /100 | #134 | Excellent 4.6% |
| Immigrants | Europe | 79.4 /100 | #135 | Good 4.6% |
| Scotch-Irish | 79.3 /100 | #136 | Good 4.6% |
| Immigrants | Iraq | 78.9 /100 | #137 | Good 4.6% |
| Immigrants | Norway | 77.5 /100 | #138 | Good 4.6% |
| Immigrants | Hungary | 76.3 /100 | #139 | Good 4.6% |
Demographics Similar to Asians by Unemployment Among Ages 35 to 44 years
In terms of unemployment among ages 35 to 44 years, the demographic groups most similar to Asians are Immigrants from Moldova (4.4%, a difference of 0.030%), Chilean (4.4%, a difference of 0.050%), Immigrants from Hong Kong (4.4%, a difference of 0.12%), English (4.4%, a difference of 0.15%), and Immigrants from Argentina (4.4%, a difference of 0.16%).
| Demographics | Rating | Rank | Unemployment Among Ages 35 to 44 years |
| British | 98.3 /100 | #47 | Exceptional 4.4% |
| Bhutanese | 98.2 /100 | #48 | Exceptional 4.4% |
| Swiss | 98.2 /100 | #49 | Exceptional 4.4% |
| Immigrants | Turkey | 97.8 /100 | #50 | Exceptional 4.4% |
| Immigrants | Eastern Asia | 97.8 /100 | #51 | Exceptional 4.4% |
| Okinawans | 97.7 /100 | #52 | Exceptional 4.4% |
| Immigrants | Argentina | 97.6 /100 | #53 | Exceptional 4.4% |
| Asians | 97.4 /100 | #54 | Exceptional 4.4% |
| Immigrants | Moldova | 97.3 /100 | #55 | Exceptional 4.4% |
| Chileans | 97.3 /100 | #56 | Exceptional 4.4% |
| Immigrants | Hong Kong | 97.2 /100 | #57 | Exceptional 4.4% |
| English | 97.2 /100 | #58 | Exceptional 4.4% |
| Greeks | 97.1 /100 | #59 | Exceptional 4.4% |
| Taiwanese | 97.1 /100 | #60 | Exceptional 4.4% |
| Croatians | 97.1 /100 | #61 | Exceptional 4.4% |