Chilean vs Argentinean Unemployment Among Ages 45 to 54 years
COMPARE
Chilean
Argentinean
Unemployment Among Ages 45 to 54 years
Unemployment Among Ages 45 to 54 years Comparison
Chileans
Argentineans
4.3%
UNEMPLOYMENT AMONG AGES 45 TO 54 YEARS
98.1/ 100
METRIC RATING
77th/ 347
METRIC RANK
4.3%
UNEMPLOYMENT AMONG AGES 45 TO 54 YEARS
96.5/ 100
METRIC RATING
93rd/ 347
METRIC RANK
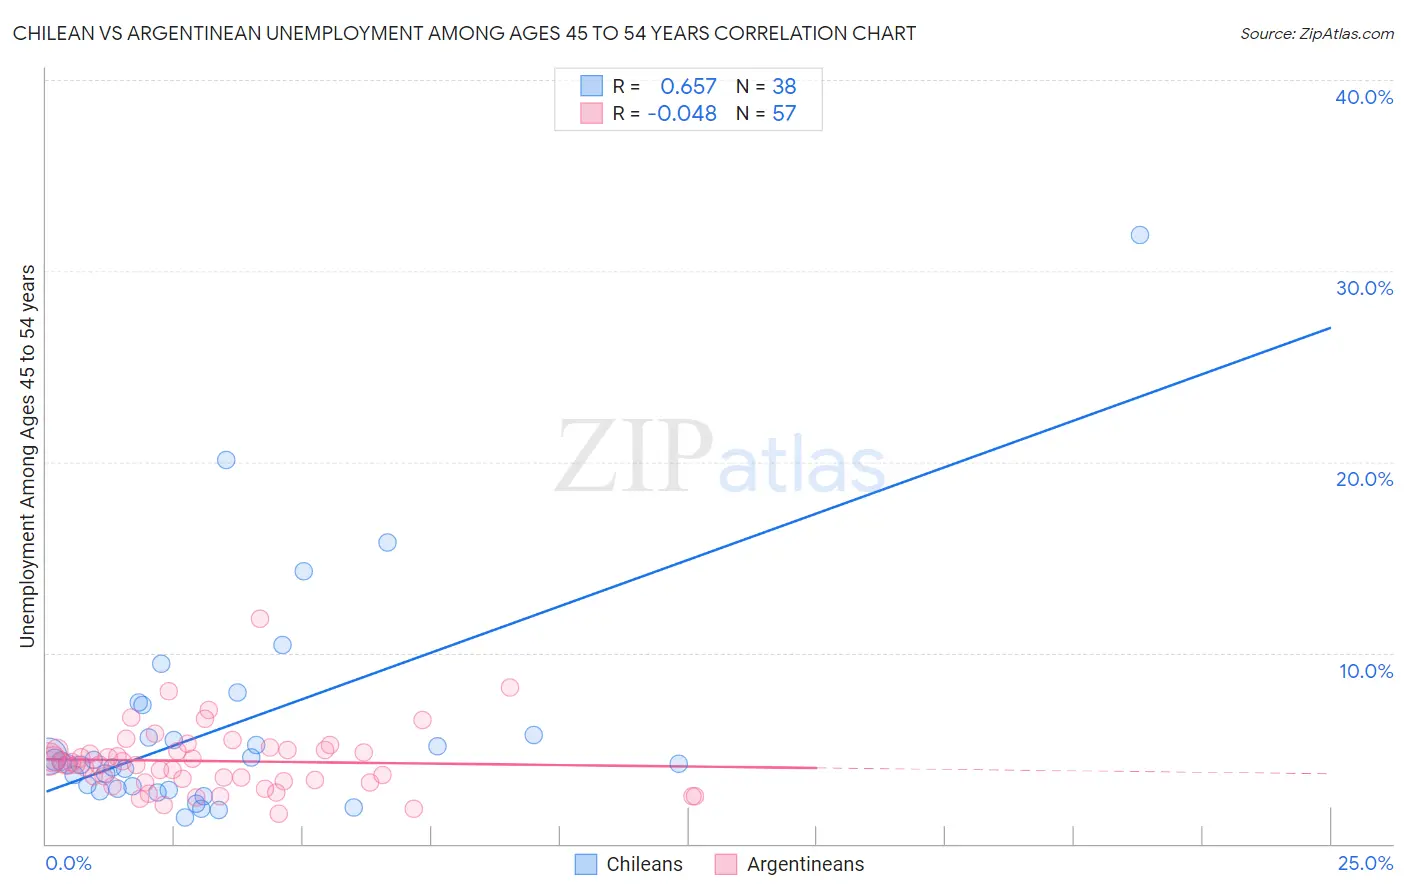
Chilean vs Argentinean Unemployment Among Ages 45 to 54 years Correlation Chart
The statistical analysis conducted on geographies consisting of 253,659,232 people shows a significant positive correlation between the proportion of Chileans and unemployment rate among population between the ages 45 and 54 in the United States with a correlation coefficient (R) of 0.657 and weighted average of 4.3%. Similarly, the statistical analysis conducted on geographies consisting of 293,478,547 people shows no correlation between the proportion of Argentineans and unemployment rate among population between the ages 45 and 54 in the United States with a correlation coefficient (R) of -0.048 and weighted average of 4.3%, a difference of 0.72%.
Unemployment Among Ages 45 to 54 years Correlation Summary
| Measurement | Chilean | Argentinean |
| Minimum | 1.4% | 1.6% |
| Maximum | 31.9% | 11.8% |
| Range | 30.5% | 10.2% |
| Mean | 6.1% | 4.3% |
| Median | 4.3% | 4.2% |
| Interquartile 25% (IQ1) | 2.9% | 3.3% |
| Interquartile 75% (IQ3) | 5.7% | 4.9% |
| Interquartile Range (IQR) | 2.8% | 1.6% |
| Standard Deviation (Sample) | 5.9% | 1.7% |
| Standard Deviation (Population) | 5.8% | 1.7% |
Demographics Similar to Chileans and Argentineans by Unemployment Among Ages 45 to 54 years
In terms of unemployment among ages 45 to 54 years, the demographic groups most similar to Chileans are Slavic (4.3%, a difference of 0.050%), Kenyan (4.3%, a difference of 0.060%), German Russian (4.3%, a difference of 0.090%), Serbian (4.3%, a difference of 0.090%), and Cambodian (4.3%, a difference of 0.16%). Similarly, the demographic groups most similar to Argentineans are Mongolian (4.3%, a difference of 0.010%), Ukrainian (4.3%, a difference of 0.040%), Asian (4.3%, a difference of 0.10%), Immigrants from Malaysia (4.4%, a difference of 0.12%), and Immigrants from Turkey (4.3%, a difference of 0.16%).
| Demographics | Rating | Rank | Unemployment Among Ages 45 to 54 years |
| Kenyans | 98.1 /100 | #75 | Exceptional 4.3% |
| Slavs | 98.1 /100 | #76 | Exceptional 4.3% |
| Chileans | 98.1 /100 | #77 | Exceptional 4.3% |
| German Russians | 97.9 /100 | #78 | Exceptional 4.3% |
| Serbians | 97.9 /100 | #79 | Exceptional 4.3% |
| Cambodians | 97.8 /100 | #80 | Exceptional 4.3% |
| Immigrants | Micronesia | 97.6 /100 | #81 | Exceptional 4.3% |
| Eastern Europeans | 97.6 /100 | #82 | Exceptional 4.3% |
| Australians | 97.4 /100 | #83 | Exceptional 4.3% |
| Italians | 97.3 /100 | #84 | Exceptional 4.3% |
| French | 97.3 /100 | #85 | Exceptional 4.3% |
| Ethiopians | 97.2 /100 | #86 | Exceptional 4.3% |
| Sudanese | 97.0 /100 | #87 | Exceptional 4.3% |
| Immigrants | Turkey | 96.9 /100 | #88 | Exceptional 4.3% |
| Immigrants | Argentina | 96.9 /100 | #89 | Exceptional 4.3% |
| Asians | 96.8 /100 | #90 | Exceptional 4.3% |
| Ukrainians | 96.6 /100 | #91 | Exceptional 4.3% |
| Mongolians | 96.6 /100 | #92 | Exceptional 4.3% |
| Argentineans | 96.5 /100 | #93 | Exceptional 4.3% |
| Immigrants | Malaysia | 96.2 /100 | #94 | Exceptional 4.4% |
| Immigrants | Ethiopia | 96.1 /100 | #95 | Exceptional 4.4% |