Chickasaw vs Osage Unemployment Among Ages 45 to 54 years
COMPARE
Chickasaw
Osage
Unemployment Among Ages 45 to 54 years
Unemployment Among Ages 45 to 54 years Comparison
Chickasaw
Osage
4.2%
UNEMPLOYMENT AMONG AGES 45 TO 54 YEARS
99.5/ 100
METRIC RATING
54th/ 347
METRIC RANK
4.2%
UNEMPLOYMENT AMONG AGES 45 TO 54 YEARS
99.8/ 100
METRIC RATING
37th/ 347
METRIC RANK
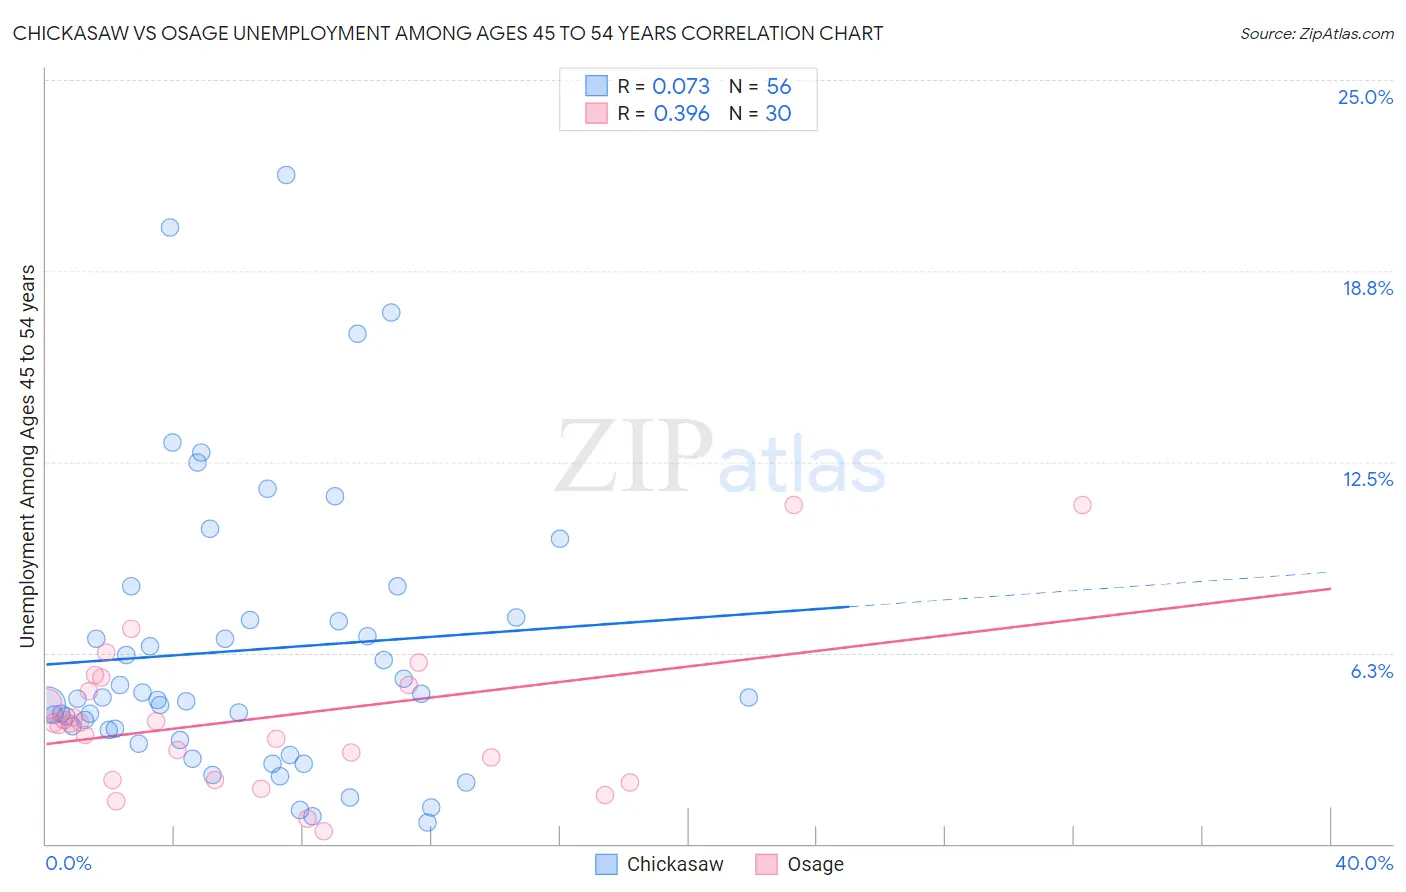
Chickasaw vs Osage Unemployment Among Ages 45 to 54 years Correlation Chart
The statistical analysis conducted on geographies consisting of 145,306,851 people shows a slight positive correlation between the proportion of Chickasaw and unemployment rate among population between the ages 45 and 54 in the United States with a correlation coefficient (R) of 0.073 and weighted average of 4.2%. Similarly, the statistical analysis conducted on geographies consisting of 90,806,730 people shows a mild positive correlation between the proportion of Osage and unemployment rate among population between the ages 45 and 54 in the United States with a correlation coefficient (R) of 0.396 and weighted average of 4.2%, a difference of 1.4%.
Unemployment Among Ages 45 to 54 years Correlation Summary
| Measurement | Chickasaw | Osage |
| Minimum | 0.70% | 0.40% |
| Maximum | 21.9% | 11.1% |
| Range | 21.2% | 10.7% |
| Mean | 6.3% | 4.1% |
| Median | 4.8% | 3.9% |
| Interquartile 25% (IQ1) | 3.6% | 2.1% |
| Interquartile 75% (IQ3) | 7.4% | 5.2% |
| Interquartile Range (IQR) | 3.8% | 3.1% |
| Standard Deviation (Sample) | 4.7% | 2.5% |
| Standard Deviation (Population) | 4.7% | 2.5% |
Demographics Similar to Chickasaw and Osage by Unemployment Among Ages 45 to 54 years
In terms of unemployment among ages 45 to 54 years, the demographic groups most similar to Chickasaw are Irish (4.2%, a difference of 0.0%), Polish (4.2%, a difference of 0.050%), Latvian (4.2%, a difference of 0.12%), Burmese (4.2%, a difference of 0.31%), and Basque (4.2%, a difference of 0.32%). Similarly, the demographic groups most similar to Osage are Scotch-Irish (4.2%, a difference of 0.010%), Croatian (4.2%, a difference of 0.020%), Immigrants from Taiwan (4.2%, a difference of 0.030%), Jordanian (4.2%, a difference of 0.16%), and Northern European (4.2%, a difference of 0.36%).
| Demographics | Rating | Rank | Unemployment Among Ages 45 to 54 years |
| Immigrants | Taiwan | 99.8 /100 | #35 | Exceptional 4.2% |
| Croatians | 99.8 /100 | #36 | Exceptional 4.2% |
| Osage | 99.8 /100 | #37 | Exceptional 4.2% |
| Scotch-Irish | 99.8 /100 | #38 | Exceptional 4.2% |
| Jordanians | 99.8 /100 | #39 | Exceptional 4.2% |
| Northern Europeans | 99.8 /100 | #40 | Exceptional 4.2% |
| Czechoslovakians | 99.8 /100 | #41 | Exceptional 4.2% |
| Immigrants | Scotland | 99.8 /100 | #42 | Exceptional 4.2% |
| Zimbabweans | 99.8 /100 | #43 | Exceptional 4.2% |
| Immigrants | Singapore | 99.7 /100 | #44 | Exceptional 4.2% |
| Immigrants | Bulgaria | 99.7 /100 | #45 | Exceptional 4.2% |
| Luxembourgers | 99.6 /100 | #46 | Exceptional 4.2% |
| Filipinos | 99.6 /100 | #47 | Exceptional 4.2% |
| Finns | 99.6 /100 | #48 | Exceptional 4.2% |
| Immigrants | Zimbabwe | 99.6 /100 | #49 | Exceptional 4.2% |
| Basques | 99.6 /100 | #50 | Exceptional 4.2% |
| Burmese | 99.6 /100 | #51 | Exceptional 4.2% |
| Poles | 99.5 /100 | #52 | Exceptional 4.2% |
| Irish | 99.5 /100 | #53 | Exceptional 4.2% |
| Chickasaw | 99.5 /100 | #54 | Exceptional 4.2% |
| Latvians | 99.4 /100 | #55 | Exceptional 4.2% |