Central American Indian vs Immigrants from Eastern Europe Unemployment Among Youth under 25 years
COMPARE
Central American Indian
Immigrants from Eastern Europe
Unemployment Among Youth under 25 years
Unemployment Among Youth under 25 years Comparison
Central American Indians
Immigrants from Eastern Europe
13.5%
UNEMPLOYMENT AMONG YOUTH UNDER 25 YEARS
0.0/ 100
METRIC RATING
292nd/ 347
METRIC RANK
11.7%
UNEMPLOYMENT AMONG YOUTH UNDER 25 YEARS
34.1/ 100
METRIC RATING
184th/ 347
METRIC RANK
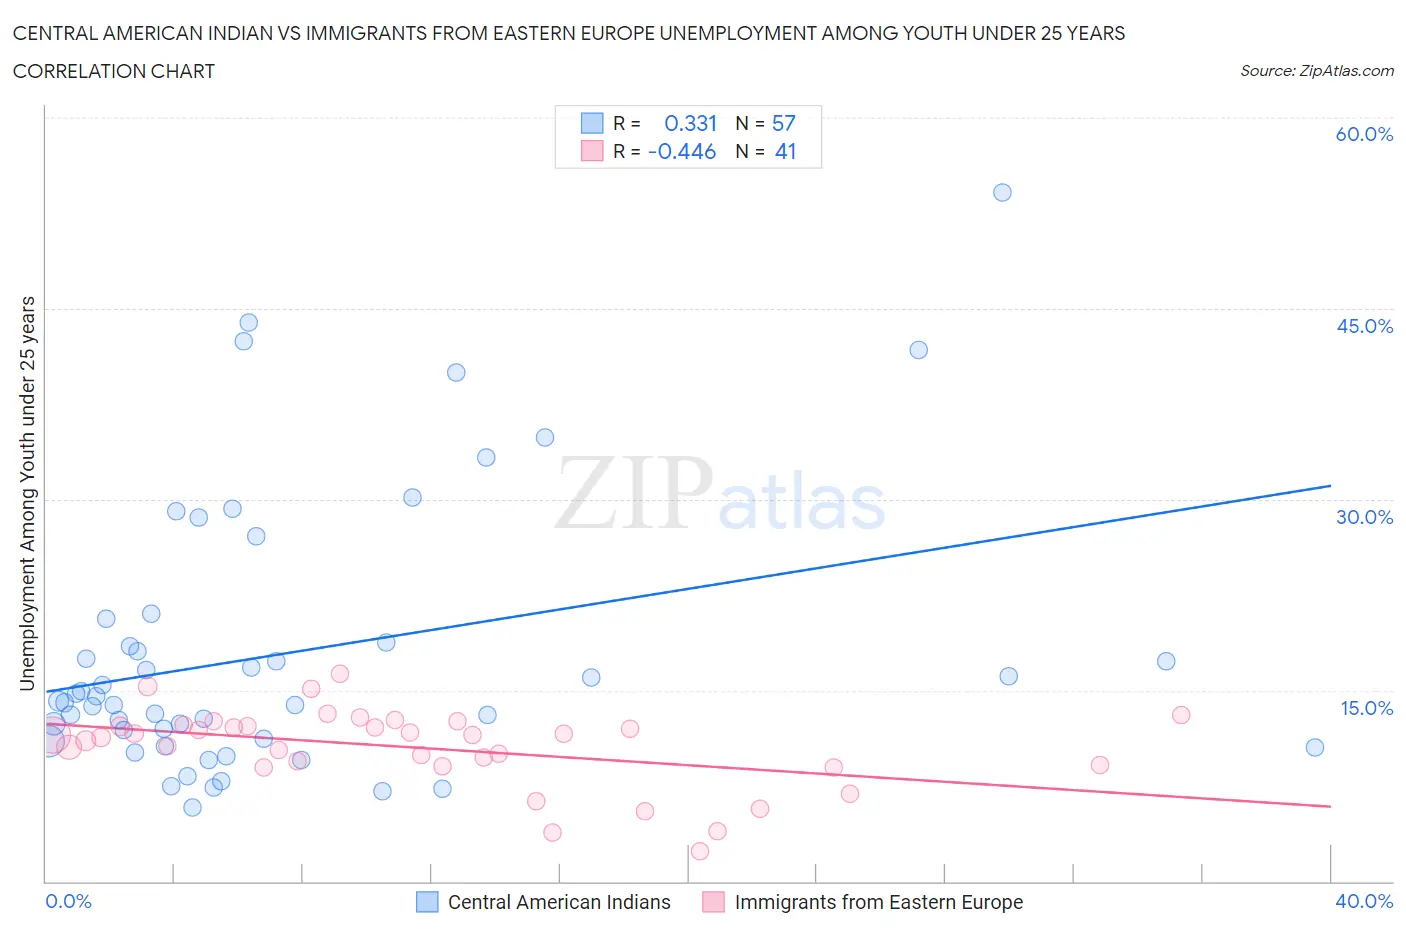
Central American Indian vs Immigrants from Eastern Europe Unemployment Among Youth under 25 years Correlation Chart
The statistical analysis conducted on geographies consisting of 324,054,226 people shows a mild positive correlation between the proportion of Central American Indians and unemployment rate among youth under the age of 25 in the United States with a correlation coefficient (R) of 0.331 and weighted average of 13.5%. Similarly, the statistical analysis conducted on geographies consisting of 466,316,471 people shows a moderate negative correlation between the proportion of Immigrants from Eastern Europe and unemployment rate among youth under the age of 25 in the United States with a correlation coefficient (R) of -0.446 and weighted average of 11.7%, a difference of 15.2%.
Unemployment Among Youth under 25 years Correlation Summary
| Measurement | Central American Indian | Immigrants from Eastern Europe |
| Minimum | 5.8% | 2.4% |
| Maximum | 54.1% | 16.3% |
| Range | 48.3% | 13.9% |
| Mean | 18.0% | 10.5% |
| Median | 14.1% | 11.5% |
| Interquartile 25% (IQ1) | 11.1% | 9.0% |
| Interquartile 75% (IQ3) | 19.7% | 12.2% |
| Interquartile Range (IQR) | 8.6% | 3.2% |
| Standard Deviation (Sample) | 10.7% | 3.1% |
| Standard Deviation (Population) | 10.6% | 3.0% |
Similar Demographics by Unemployment Among Youth under 25 years
Demographics Similar to Central American Indians by Unemployment Among Youth under 25 years
In terms of unemployment among youth under 25 years, the demographic groups most similar to Central American Indians are Apache (13.5%, a difference of 0.030%), Spanish American Indian (13.5%, a difference of 0.11%), Immigrants from Caribbean (13.5%, a difference of 0.27%), Immigrants from Ecuador (13.4%, a difference of 0.28%), and Chippewa (13.5%, a difference of 0.51%).
| Demographics | Rating | Rank | Unemployment Among Youth under 25 years |
| Ghanaians | 0.0 /100 | #285 | Tragic 13.3% |
| Blackfeet | 0.0 /100 | #286 | Tragic 13.3% |
| Ecuadorians | 0.0 /100 | #287 | Tragic 13.3% |
| Immigrants | Western Africa | 0.0 /100 | #288 | Tragic 13.4% |
| Immigrants | Ghana | 0.0 /100 | #289 | Tragic 13.4% |
| Immigrants | Ecuador | 0.0 /100 | #290 | Tragic 13.4% |
| Apache | 0.0 /100 | #291 | Tragic 13.5% |
| Central American Indians | 0.0 /100 | #292 | Tragic 13.5% |
| Spanish American Indians | 0.0 /100 | #293 | Tragic 13.5% |
| Immigrants | Caribbean | 0.0 /100 | #294 | Tragic 13.5% |
| Chippewa | 0.0 /100 | #295 | Tragic 13.5% |
| Senegalese | 0.0 /100 | #296 | Tragic 13.5% |
| U.S. Virgin Islanders | 0.0 /100 | #297 | Tragic 13.6% |
| Shoshone | 0.0 /100 | #298 | Tragic 13.7% |
| Tohono O'odham | 0.0 /100 | #299 | Tragic 13.8% |
Demographics Similar to Immigrants from Eastern Europe by Unemployment Among Youth under 25 years
In terms of unemployment among youth under 25 years, the demographic groups most similar to Immigrants from Eastern Europe are American (11.7%, a difference of 0.010%), French American Indian (11.7%, a difference of 0.010%), Maltese (11.7%, a difference of 0.010%), Immigrants from Italy (11.7%, a difference of 0.090%), and Immigrants from Egypt (11.7%, a difference of 0.10%).
| Demographics | Rating | Rank | Unemployment Among Youth under 25 years |
| Immigrants | Denmark | 45.0 /100 | #177 | Average 11.6% |
| Immigrants | Europe | 42.4 /100 | #178 | Average 11.6% |
| Immigrants | Hong Kong | 42.4 /100 | #179 | Average 11.6% |
| Spaniards | 39.8 /100 | #180 | Fair 11.7% |
| Syrians | 38.4 /100 | #181 | Fair 11.7% |
| Immigrants | Italy | 36.2 /100 | #182 | Fair 11.7% |
| Americans | 34.5 /100 | #183 | Fair 11.7% |
| Immigrants | Eastern Europe | 34.1 /100 | #184 | Fair 11.7% |
| French American Indians | 34.0 /100 | #185 | Fair 11.7% |
| Maltese | 33.9 /100 | #186 | Fair 11.7% |
| Immigrants | Egypt | 31.9 /100 | #187 | Fair 11.7% |
| Immigrants | Poland | 31.4 /100 | #188 | Fair 11.7% |
| Japanese | 30.8 /100 | #189 | Fair 11.7% |
| Portuguese | 30.3 /100 | #190 | Fair 11.7% |
| Cypriots | 28.5 /100 | #191 | Fair 11.7% |