Central American Indian vs Arapaho Unemployment Among Youth under 25 years
COMPARE
Central American Indian
Arapaho
Unemployment Among Youth under 25 years
Unemployment Among Youth under 25 years Comparison
Central American Indians
Arapaho
13.5%
UNEMPLOYMENT AMONG YOUTH UNDER 25 YEARS
0.0/ 100
METRIC RATING
292nd/ 347
METRIC RANK
16.3%
UNEMPLOYMENT AMONG YOUTH UNDER 25 YEARS
0.0/ 100
METRIC RATING
337th/ 347
METRIC RANK
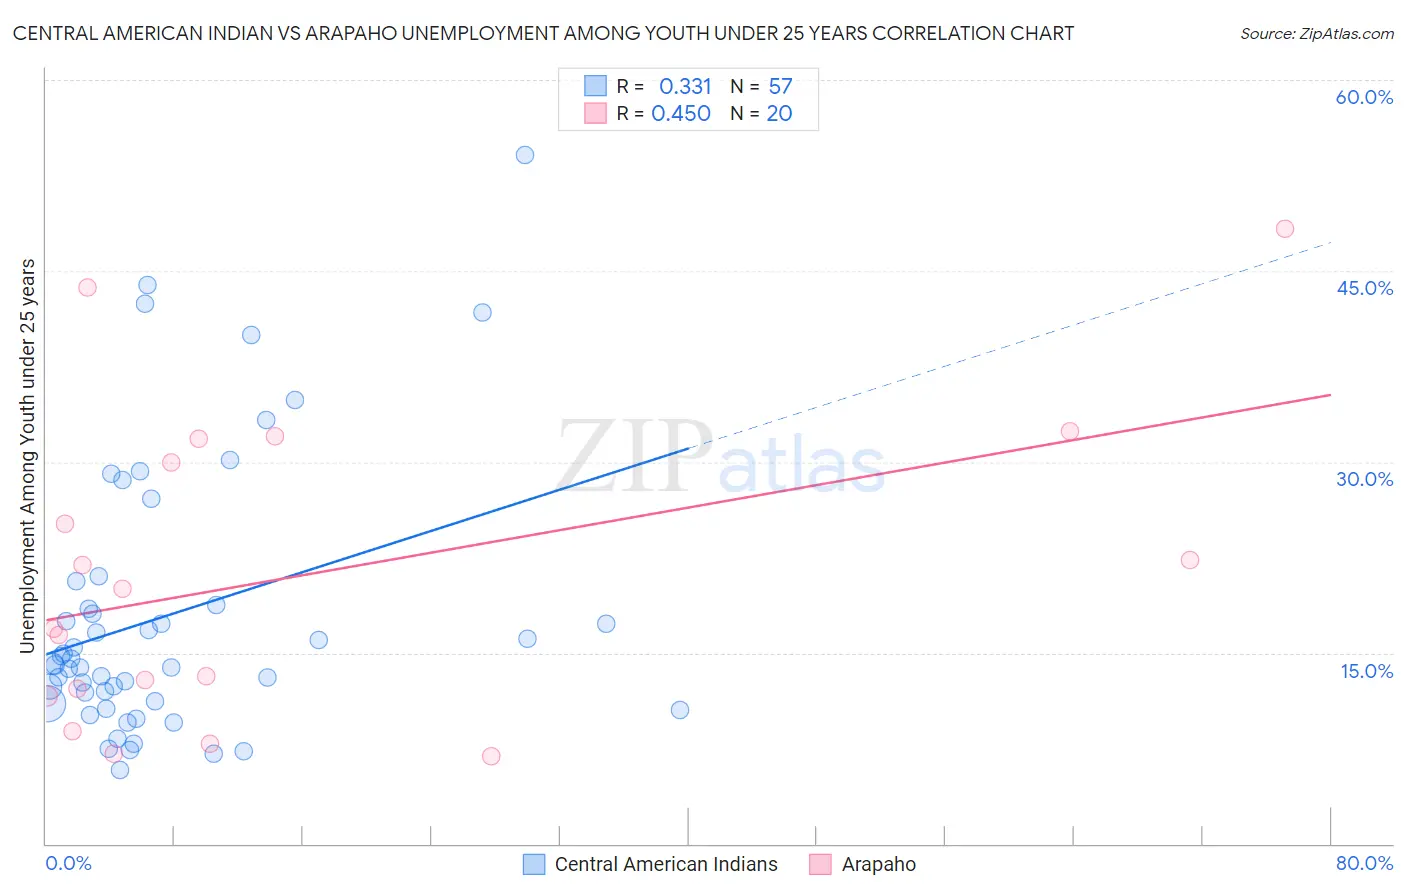
Central American Indian vs Arapaho Unemployment Among Youth under 25 years Correlation Chart
The statistical analysis conducted on geographies consisting of 324,054,226 people shows a mild positive correlation between the proportion of Central American Indians and unemployment rate among youth under the age of 25 in the United States with a correlation coefficient (R) of 0.331 and weighted average of 13.5%. Similarly, the statistical analysis conducted on geographies consisting of 29,675,287 people shows a moderate positive correlation between the proportion of Arapaho and unemployment rate among youth under the age of 25 in the United States with a correlation coefficient (R) of 0.450 and weighted average of 16.3%, a difference of 20.9%.
Unemployment Among Youth under 25 years Correlation Summary
| Measurement | Central American Indian | Arapaho |
| Minimum | 5.8% | 6.9% |
| Maximum | 54.1% | 48.3% |
| Range | 48.3% | 41.4% |
| Mean | 18.0% | 21.1% |
| Median | 14.1% | 18.4% |
| Interquartile 25% (IQ1) | 11.1% | 11.9% |
| Interquartile 75% (IQ3) | 19.7% | 30.9% |
| Interquartile Range (IQR) | 8.6% | 19.0% |
| Standard Deviation (Sample) | 10.7% | 12.1% |
| Standard Deviation (Population) | 10.6% | 11.8% |
Similar Demographics by Unemployment Among Youth under 25 years
Demographics Similar to Central American Indians by Unemployment Among Youth under 25 years
In terms of unemployment among youth under 25 years, the demographic groups most similar to Central American Indians are Apache (13.5%, a difference of 0.030%), Spanish American Indian (13.5%, a difference of 0.11%), Immigrants from Caribbean (13.5%, a difference of 0.27%), Immigrants from Ecuador (13.4%, a difference of 0.28%), and Chippewa (13.5%, a difference of 0.51%).
| Demographics | Rating | Rank | Unemployment Among Youth under 25 years |
| Ghanaians | 0.0 /100 | #285 | Tragic 13.3% |
| Blackfeet | 0.0 /100 | #286 | Tragic 13.3% |
| Ecuadorians | 0.0 /100 | #287 | Tragic 13.3% |
| Immigrants | Western Africa | 0.0 /100 | #288 | Tragic 13.4% |
| Immigrants | Ghana | 0.0 /100 | #289 | Tragic 13.4% |
| Immigrants | Ecuador | 0.0 /100 | #290 | Tragic 13.4% |
| Apache | 0.0 /100 | #291 | Tragic 13.5% |
| Central American Indians | 0.0 /100 | #292 | Tragic 13.5% |
| Spanish American Indians | 0.0 /100 | #293 | Tragic 13.5% |
| Immigrants | Caribbean | 0.0 /100 | #294 | Tragic 13.5% |
| Chippewa | 0.0 /100 | #295 | Tragic 13.5% |
| Senegalese | 0.0 /100 | #296 | Tragic 13.5% |
| U.S. Virgin Islanders | 0.0 /100 | #297 | Tragic 13.6% |
| Shoshone | 0.0 /100 | #298 | Tragic 13.7% |
| Tohono O'odham | 0.0 /100 | #299 | Tragic 13.8% |
Demographics Similar to Arapaho by Unemployment Among Youth under 25 years
In terms of unemployment among youth under 25 years, the demographic groups most similar to Arapaho are Pima (16.2%, a difference of 0.16%), Yuman (16.3%, a difference of 0.30%), Immigrants from St. Vincent and the Grenadines (16.1%, a difference of 0.80%), Tsimshian (16.5%, a difference of 1.3%), and Immigrants from Guyana (15.9%, a difference of 2.1%).
| Demographics | Rating | Rank | Unemployment Among Youth under 25 years |
| Yakama | 0.0 /100 | #330 | Tragic 15.6% |
| Dominicans | 0.0 /100 | #331 | Tragic 15.7% |
| Immigrants | Grenada | 0.0 /100 | #332 | Tragic 15.8% |
| Guyanese | 0.0 /100 | #333 | Tragic 15.9% |
| Immigrants | Guyana | 0.0 /100 | #334 | Tragic 15.9% |
| Immigrants | St. Vincent and the Grenadines | 0.0 /100 | #335 | Tragic 16.1% |
| Pima | 0.0 /100 | #336 | Tragic 16.2% |
| Arapaho | 0.0 /100 | #337 | Tragic 16.3% |
| Yuman | 0.0 /100 | #338 | Tragic 16.3% |
| Tsimshian | 0.0 /100 | #339 | Tragic 16.5% |
| Colville | 0.0 /100 | #340 | Tragic 16.8% |
| Paiute | 0.0 /100 | #341 | Tragic 17.6% |
| Puerto Ricans | 0.0 /100 | #342 | Tragic 18.4% |
| Navajo | 0.0 /100 | #343 | Tragic 18.6% |
| Crow | 0.0 /100 | #344 | Tragic 20.1% |