Canadian vs Immigrants from Singapore Unemployment Among Women with Children Ages 6 to 17 years
COMPARE
Canadian
Immigrants from Singapore
Unemployment Among Women with Children Ages 6 to 17 years
Unemployment Among Women with Children Ages 6 to 17 years Comparison
Canadians
Immigrants from Singapore
9.4%
UNEMPLOYMENT AMONG WOMEN WITH CHILDREN AGES 6 TO 17 YEARS
0.8/ 100
METRIC RATING
256th/ 347
METRIC RANK
7.7%
UNEMPLOYMENT AMONG WOMEN WITH CHILDREN AGES 6 TO 17 YEARS
100.0/ 100
METRIC RATING
20th/ 347
METRIC RANK
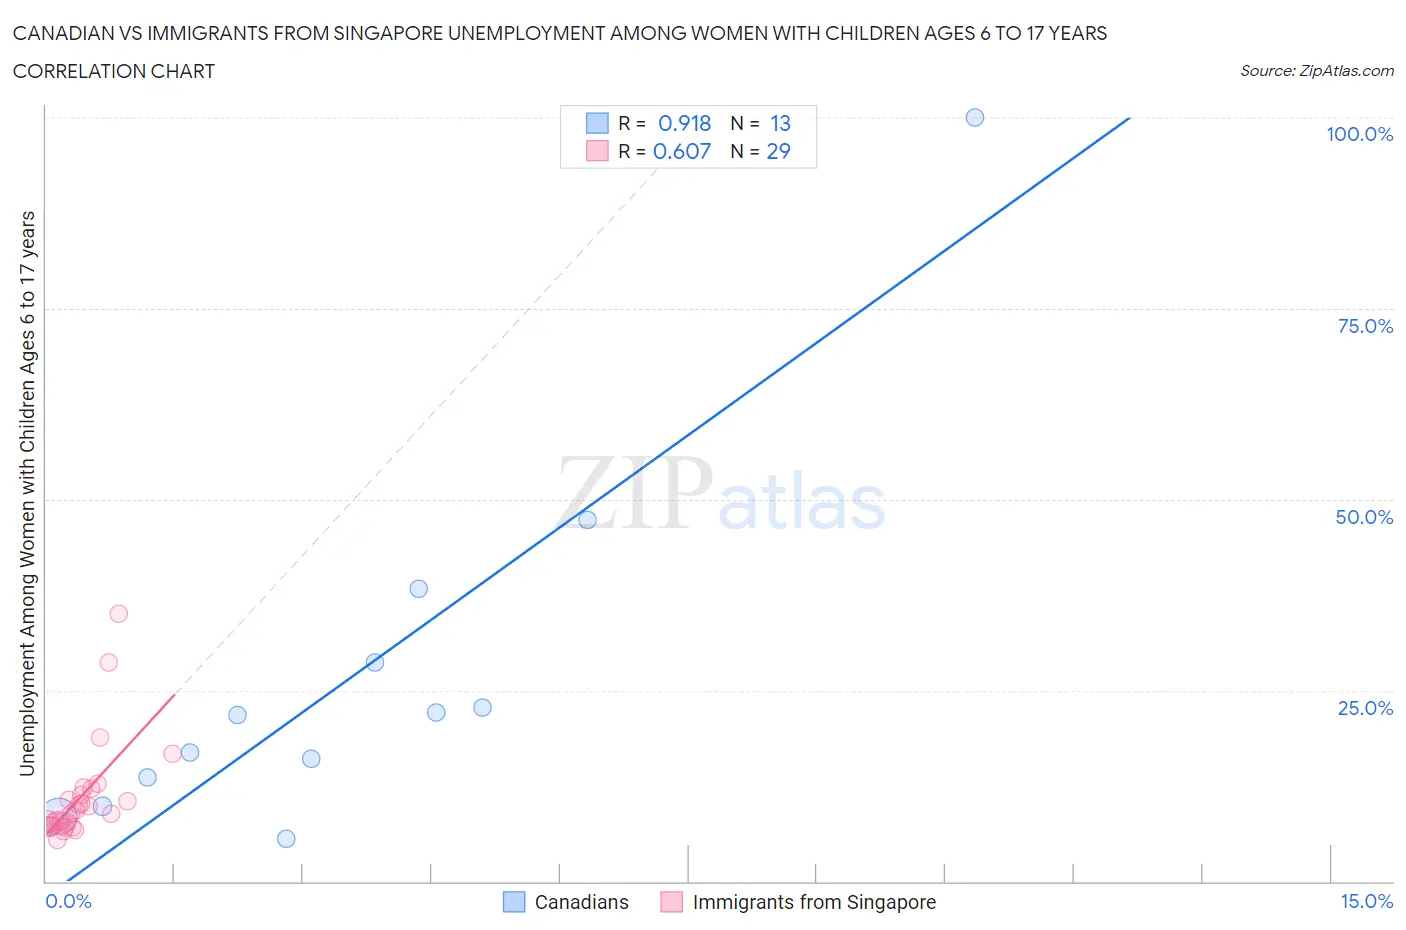
Canadian vs Immigrants from Singapore Unemployment Among Women with Children Ages 6 to 17 years Correlation Chart
The statistical analysis conducted on geographies consisting of 299,880,127 people shows a near-perfect positive correlation between the proportion of Canadians and unemployment rate among women with children between the ages 6 and 17 in the United States with a correlation coefficient (R) of 0.918 and weighted average of 9.4%. Similarly, the statistical analysis conducted on geographies consisting of 115,099,593 people shows a significant positive correlation between the proportion of Immigrants from Singapore and unemployment rate among women with children between the ages 6 and 17 in the United States with a correlation coefficient (R) of 0.607 and weighted average of 7.7%, a difference of 23.4%.
Unemployment Among Women with Children Ages 6 to 17 years Correlation Summary
| Measurement | Canadian | Immigrants from Singapore |
| Minimum | 5.6% | 5.5% |
| Maximum | 100.0% | 35.0% |
| Range | 94.4% | 29.5% |
| Mean | 27.0% | 11.0% |
| Median | 21.8% | 8.9% |
| Interquartile 25% (IQ1) | 11.7% | 7.2% |
| Interquartile 75% (IQ3) | 33.5% | 11.7% |
| Interquartile Range (IQR) | 21.8% | 4.5% |
| Standard Deviation (Sample) | 24.9% | 6.5% |
| Standard Deviation (Population) | 23.9% | 6.4% |
Similar Demographics by Unemployment Among Women with Children Ages 6 to 17 years
Demographics Similar to Canadians by Unemployment Among Women with Children Ages 6 to 17 years
In terms of unemployment among women with children ages 6 to 17 years, the demographic groups most similar to Canadians are Celtic (9.5%, a difference of 0.020%), Immigrants from Mexico (9.5%, a difference of 0.11%), Lithuanian (9.4%, a difference of 0.17%), Immigrants from Central America (9.5%, a difference of 0.20%), and Nicaraguan (9.4%, a difference of 0.23%).
| Demographics | Rating | Rank | Unemployment Among Women with Children Ages 6 to 17 years |
| Immigrants | South America | 1.5 /100 | #249 | Tragic 9.4% |
| Immigrants | Guatemala | 1.3 /100 | #250 | Tragic 9.4% |
| Central Americans | 1.3 /100 | #251 | Tragic 9.4% |
| Creek | 1.2 /100 | #252 | Tragic 9.4% |
| Portuguese | 1.1 /100 | #253 | Tragic 9.4% |
| Nicaraguans | 1.0 /100 | #254 | Tragic 9.4% |
| Lithuanians | 0.9 /100 | #255 | Tragic 9.4% |
| Canadians | 0.8 /100 | #256 | Tragic 9.4% |
| Celtics | 0.7 /100 | #257 | Tragic 9.5% |
| Immigrants | Mexico | 0.7 /100 | #258 | Tragic 9.5% |
| Immigrants | Central America | 0.6 /100 | #259 | Tragic 9.5% |
| Italians | 0.6 /100 | #260 | Tragic 9.5% |
| South Americans | 0.5 /100 | #261 | Tragic 9.5% |
| Senegalese | 0.5 /100 | #262 | Tragic 9.5% |
| Lebanese | 0.5 /100 | #263 | Tragic 9.5% |
Demographics Similar to Immigrants from Singapore by Unemployment Among Women with Children Ages 6 to 17 years
In terms of unemployment among women with children ages 6 to 17 years, the demographic groups most similar to Immigrants from Singapore are Immigrants from India (7.7%, a difference of 0.13%), Immigrants from China (7.7%, a difference of 0.42%), Immigrants from Indonesia (7.7%, a difference of 0.81%), Nepalese (7.7%, a difference of 0.81%), and Immigrants from Eastern Asia (7.7%, a difference of 0.94%).
| Demographics | Rating | Rank | Unemployment Among Women with Children Ages 6 to 17 years |
| Indonesians | 100.0 /100 | #13 | Exceptional 7.4% |
| Sudanese | 100.0 /100 | #14 | Exceptional 7.4% |
| Puget Sound Salish | 100.0 /100 | #15 | Exceptional 7.5% |
| Immigrants | Burma/Myanmar | 100.0 /100 | #16 | Exceptional 7.5% |
| Cambodians | 100.0 /100 | #17 | Exceptional 7.5% |
| Afghans | 100.0 /100 | #18 | Exceptional 7.6% |
| Filipinos | 100.0 /100 | #19 | Exceptional 7.6% |
| Immigrants | Singapore | 100.0 /100 | #20 | Exceptional 7.7% |
| Immigrants | India | 100.0 /100 | #21 | Exceptional 7.7% |
| Immigrants | China | 100.0 /100 | #22 | Exceptional 7.7% |
| Immigrants | Indonesia | 100.0 /100 | #23 | Exceptional 7.7% |
| Nepalese | 100.0 /100 | #24 | Exceptional 7.7% |
| Immigrants | Eastern Asia | 100.0 /100 | #25 | Exceptional 7.7% |
| Indians (Asian) | 100.0 /100 | #26 | Exceptional 7.7% |
| Immigrants | Afghanistan | 100.0 /100 | #27 | Exceptional 7.8% |