British West Indian vs Sioux Unemployment Among Ages 45 to 54 years
COMPARE
British West Indian
Sioux
Unemployment Among Ages 45 to 54 years
Unemployment Among Ages 45 to 54 years Comparison
British West Indians
Sioux
5.7%
UNEMPLOYMENT AMONG AGES 45 TO 54 YEARS
0.0/ 100
METRIC RATING
318th/ 347
METRIC RANK
6.6%
UNEMPLOYMENT AMONG AGES 45 TO 54 YEARS
0.0/ 100
METRIC RATING
334th/ 347
METRIC RANK
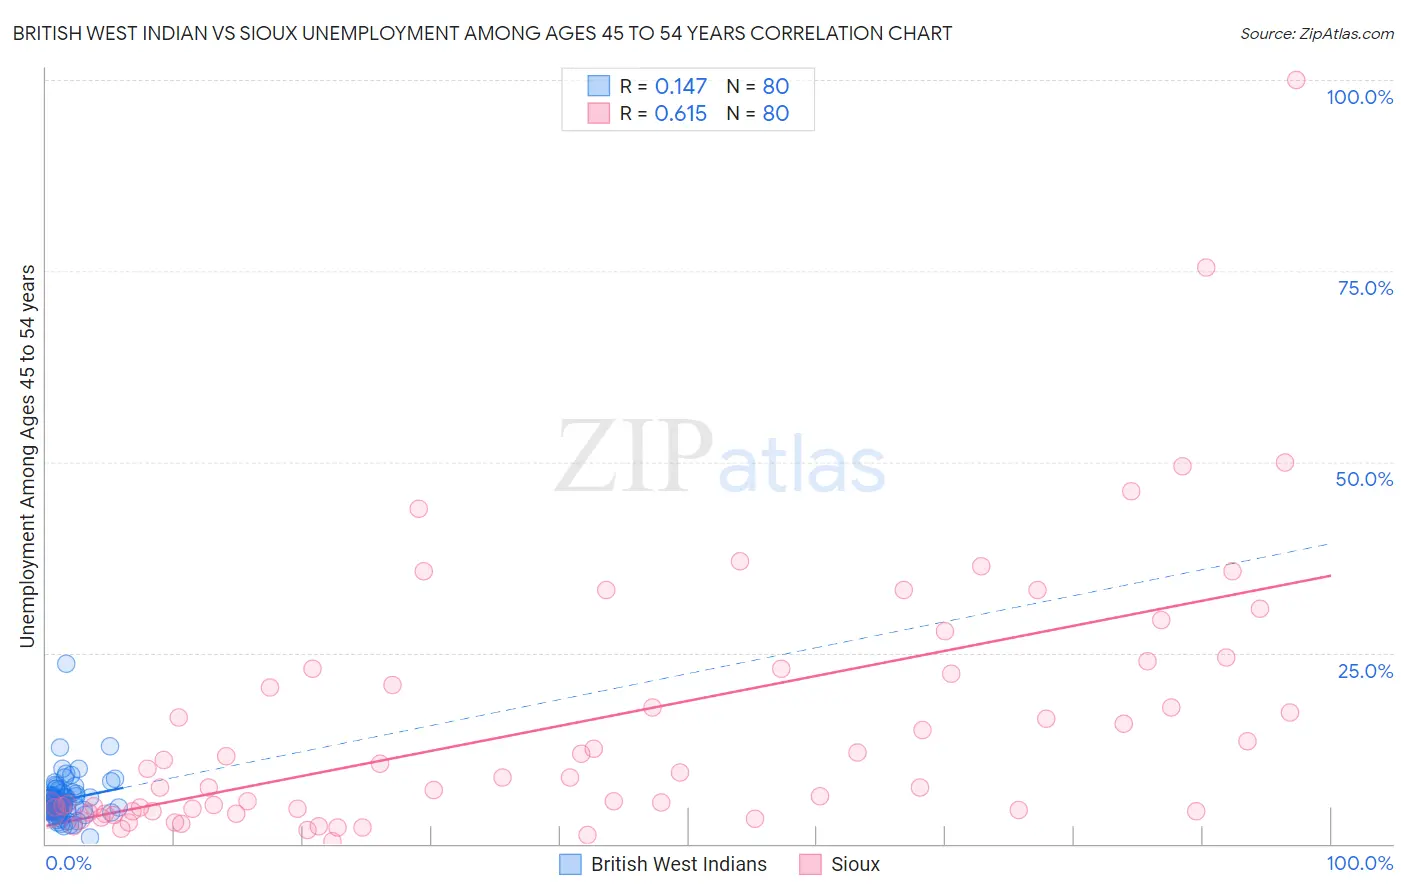
British West Indian vs Sioux Unemployment Among Ages 45 to 54 years Correlation Chart
The statistical analysis conducted on geographies consisting of 151,336,276 people shows a poor positive correlation between the proportion of British West Indians and unemployment rate among population between the ages 45 and 54 in the United States with a correlation coefficient (R) of 0.147 and weighted average of 5.7%. Similarly, the statistical analysis conducted on geographies consisting of 228,184,018 people shows a significant positive correlation between the proportion of Sioux and unemployment rate among population between the ages 45 and 54 in the United States with a correlation coefficient (R) of 0.615 and weighted average of 6.6%, a difference of 16.8%.
Unemployment Among Ages 45 to 54 years Correlation Summary
| Measurement | British West Indian | Sioux |
| Minimum | 0.80% | 0.30% |
| Maximum | 23.6% | 100.0% |
| Range | 22.8% | 99.7% |
| Mean | 5.8% | 15.6% |
| Median | 5.1% | 8.7% |
| Interquartile 25% (IQ1) | 4.3% | 4.3% |
| Interquartile 75% (IQ3) | 6.5% | 22.5% |
| Interquartile Range (IQR) | 2.2% | 18.2% |
| Standard Deviation (Sample) | 2.9% | 17.4% |
| Standard Deviation (Population) | 2.9% | 17.3% |
Demographics Similar to British West Indians and Sioux by Unemployment Among Ages 45 to 54 years
In terms of unemployment among ages 45 to 54 years, the demographic groups most similar to British West Indians are Cape Verdean (5.7%, a difference of 0.55%), Immigrants from St. Vincent and the Grenadines (5.7%, a difference of 0.55%), Houma (5.6%, a difference of 0.63%), Immigrants from Guyana (5.6%, a difference of 0.72%), and Yakama (5.7%, a difference of 0.90%). Similarly, the demographic groups most similar to Sioux are Navajo (6.7%, a difference of 0.48%), Immigrants from Yemen (6.5%, a difference of 1.1%), Puerto Rican (6.8%, a difference of 2.7%), Pima (6.4%, a difference of 2.8%), and Tohono O'odham (6.3%, a difference of 5.6%).
| Demographics | Rating | Rank | Unemployment Among Ages 45 to 54 years |
| Immigrants | Guyana | 0.0 /100 | #316 | Tragic 5.6% |
| Houma | 0.0 /100 | #317 | Tragic 5.6% |
| British West Indians | 0.0 /100 | #318 | Tragic 5.7% |
| Cape Verdeans | 0.0 /100 | #319 | Tragic 5.7% |
| Immigrants | St. Vincent and the Grenadines | 0.0 /100 | #320 | Tragic 5.7% |
| Yakama | 0.0 /100 | #321 | Tragic 5.7% |
| Immigrants | Azores | 0.0 /100 | #322 | Tragic 5.7% |
| Immigrants | Cabo Verde | 0.0 /100 | #323 | Tragic 5.9% |
| Natives/Alaskans | 0.0 /100 | #324 | Tragic 6.1% |
| Immigrants | Armenia | 0.0 /100 | #325 | Tragic 6.1% |
| Ute | 0.0 /100 | #326 | Tragic 6.2% |
| Dominicans | 0.0 /100 | #327 | Tragic 6.2% |
| Pueblo | 0.0 /100 | #328 | Tragic 6.2% |
| Alaska Natives | 0.0 /100 | #329 | Tragic 6.3% |
| Immigrants | Dominican Republic | 0.0 /100 | #330 | Tragic 6.3% |
| Tohono O'odham | 0.0 /100 | #331 | Tragic 6.3% |
| Pima | 0.0 /100 | #332 | Tragic 6.4% |
| Immigrants | Yemen | 0.0 /100 | #333 | Tragic 6.5% |
| Sioux | 0.0 /100 | #334 | Tragic 6.6% |
| Navajo | 0.0 /100 | #335 | Tragic 6.7% |
| Puerto Ricans | 0.0 /100 | #336 | Tragic 6.8% |