British West Indian vs Immigrants from Sudan Unemployment Among Ages 45 to 54 years
COMPARE
British West Indian
Immigrants from Sudan
Unemployment Among Ages 45 to 54 years
Unemployment Among Ages 45 to 54 years Comparison
British West Indians
Immigrants from Sudan
5.7%
UNEMPLOYMENT AMONG AGES 45 TO 54 YEARS
0.0/ 100
METRIC RATING
318th/ 347
METRIC RANK
4.3%
UNEMPLOYMENT AMONG AGES 45 TO 54 YEARS
99.0/ 100
METRIC RATING
65th/ 347
METRIC RANK
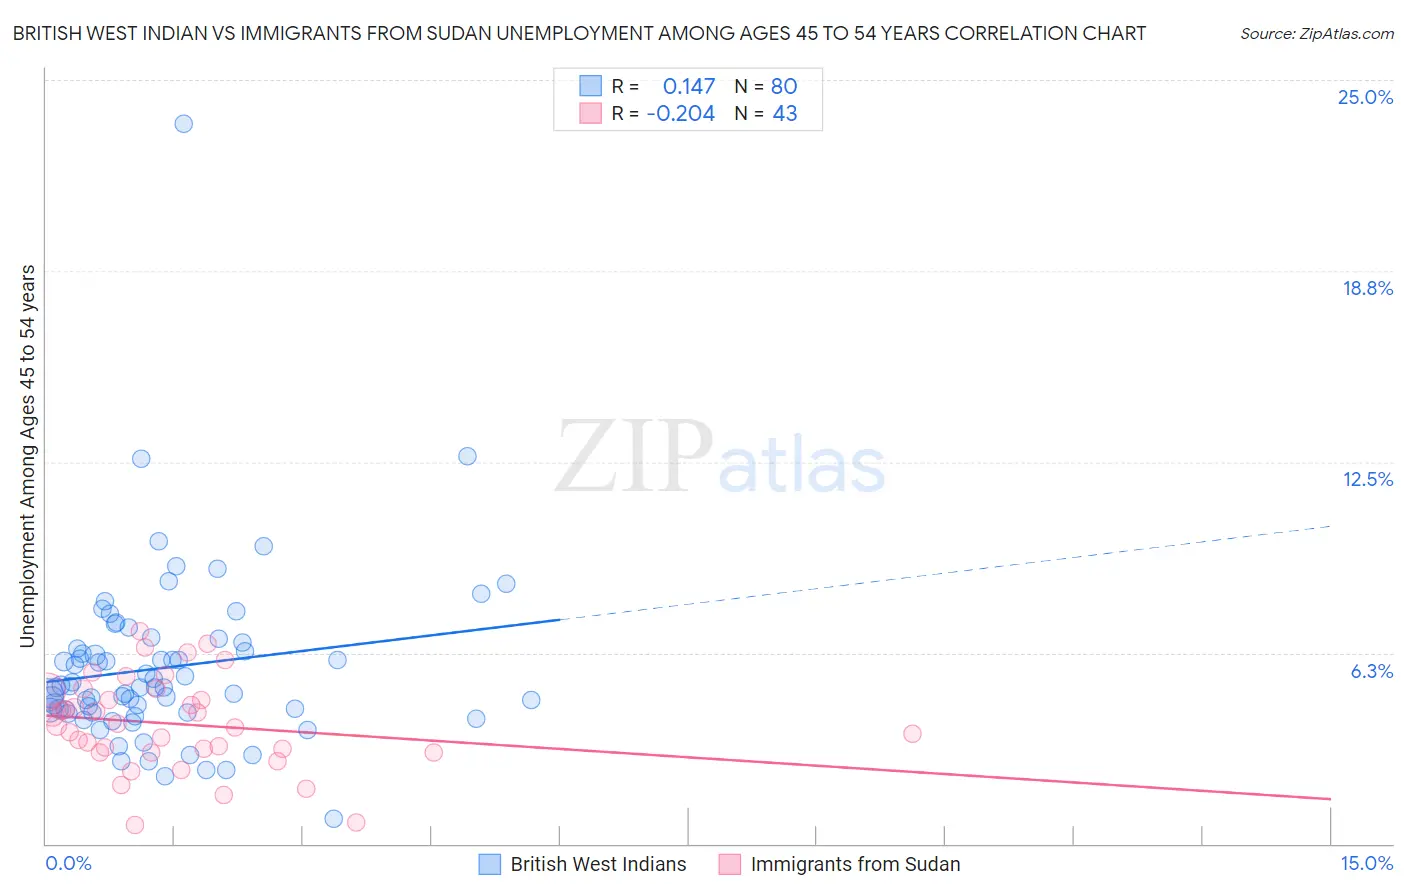
British West Indian vs Immigrants from Sudan Unemployment Among Ages 45 to 54 years Correlation Chart
The statistical analysis conducted on geographies consisting of 151,336,276 people shows a poor positive correlation between the proportion of British West Indians and unemployment rate among population between the ages 45 and 54 in the United States with a correlation coefficient (R) of 0.147 and weighted average of 5.7%. Similarly, the statistical analysis conducted on geographies consisting of 118,227,031 people shows a weak negative correlation between the proportion of Immigrants from Sudan and unemployment rate among population between the ages 45 and 54 in the United States with a correlation coefficient (R) of -0.204 and weighted average of 4.3%, a difference of 32.4%.
Unemployment Among Ages 45 to 54 years Correlation Summary
| Measurement | British West Indian | Immigrants from Sudan |
| Minimum | 0.80% | 0.62% |
| Maximum | 23.6% | 7.0% |
| Range | 22.8% | 6.4% |
| Mean | 5.8% | 3.9% |
| Median | 5.1% | 3.9% |
| Interquartile 25% (IQ1) | 4.3% | 3.0% |
| Interquartile 75% (IQ3) | 6.5% | 5.0% |
| Interquartile Range (IQR) | 2.2% | 2.0% |
| Standard Deviation (Sample) | 2.9% | 1.5% |
| Standard Deviation (Population) | 2.9% | 1.5% |
Similar Demographics by Unemployment Among Ages 45 to 54 years
Demographics Similar to British West Indians by Unemployment Among Ages 45 to 54 years
In terms of unemployment among ages 45 to 54 years, the demographic groups most similar to British West Indians are Cape Verdean (5.7%, a difference of 0.55%), Immigrants from St. Vincent and the Grenadines (5.7%, a difference of 0.55%), Houma (5.6%, a difference of 0.63%), Immigrants from Guyana (5.6%, a difference of 0.72%), and Yakama (5.7%, a difference of 0.90%).
| Demographics | Rating | Rank | Unemployment Among Ages 45 to 54 years |
| Chippewa | 0.0 /100 | #311 | Tragic 5.5% |
| Immigrants | Grenada | 0.0 /100 | #312 | Tragic 5.6% |
| Shoshone | 0.0 /100 | #313 | Tragic 5.6% |
| Guyanese | 0.0 /100 | #314 | Tragic 5.6% |
| Immigrants | Dominica | 0.0 /100 | #315 | Tragic 5.6% |
| Immigrants | Guyana | 0.0 /100 | #316 | Tragic 5.6% |
| Houma | 0.0 /100 | #317 | Tragic 5.6% |
| British West Indians | 0.0 /100 | #318 | Tragic 5.7% |
| Cape Verdeans | 0.0 /100 | #319 | Tragic 5.7% |
| Immigrants | St. Vincent and the Grenadines | 0.0 /100 | #320 | Tragic 5.7% |
| Yakama | 0.0 /100 | #321 | Tragic 5.7% |
| Immigrants | Azores | 0.0 /100 | #322 | Tragic 5.7% |
| Immigrants | Cabo Verde | 0.0 /100 | #323 | Tragic 5.9% |
| Natives/Alaskans | 0.0 /100 | #324 | Tragic 6.1% |
| Immigrants | Armenia | 0.0 /100 | #325 | Tragic 6.1% |
Demographics Similar to Immigrants from Sudan by Unemployment Among Ages 45 to 54 years
In terms of unemployment among ages 45 to 54 years, the demographic groups most similar to Immigrants from Sudan are Austrian (4.3%, a difference of 0.030%), Turkish (4.3%, a difference of 0.040%), Immigrants from Nepal (4.3%, a difference of 0.060%), Pennsylvania German (4.3%, a difference of 0.13%), and Slovak (4.3%, a difference of 0.13%).
| Demographics | Rating | Rank | Unemployment Among Ages 45 to 54 years |
| Greeks | 99.3 /100 | #58 | Exceptional 4.3% |
| Okinawans | 99.2 /100 | #59 | Exceptional 4.3% |
| Immigrants | Korea | 99.2 /100 | #60 | Exceptional 4.3% |
| Immigrants | Pakistan | 99.2 /100 | #61 | Exceptional 4.3% |
| Lithuanians | 99.1 /100 | #62 | Exceptional 4.3% |
| Pennsylvania Germans | 99.1 /100 | #63 | Exceptional 4.3% |
| Austrians | 99.0 /100 | #64 | Exceptional 4.3% |
| Immigrants | Sudan | 99.0 /100 | #65 | Exceptional 4.3% |
| Turks | 98.9 /100 | #66 | Exceptional 4.3% |
| Immigrants | Nepal | 98.9 /100 | #67 | Exceptional 4.3% |
| Slovaks | 98.8 /100 | #68 | Exceptional 4.3% |
| Immigrants | Japan | 98.7 /100 | #69 | Exceptional 4.3% |
| Paraguayans | 98.6 /100 | #70 | Exceptional 4.3% |
| Palestinians | 98.5 /100 | #71 | Exceptional 4.3% |
| Whites/Caucasians | 98.4 /100 | #72 | Exceptional 4.3% |