Bermudan vs Spanish American Indian Unemployment Among Youth under 25 years
COMPARE
Bermudan
Spanish American Indian
Unemployment Among Youth under 25 years
Unemployment Among Youth under 25 years Comparison
Bermudans
Spanish American Indians
13.0%
UNEMPLOYMENT AMONG YOUTH UNDER 25 YEARS
0.0/ 100
METRIC RATING
275th/ 347
METRIC RANK
13.5%
UNEMPLOYMENT AMONG YOUTH UNDER 25 YEARS
0.0/ 100
METRIC RATING
293rd/ 347
METRIC RANK
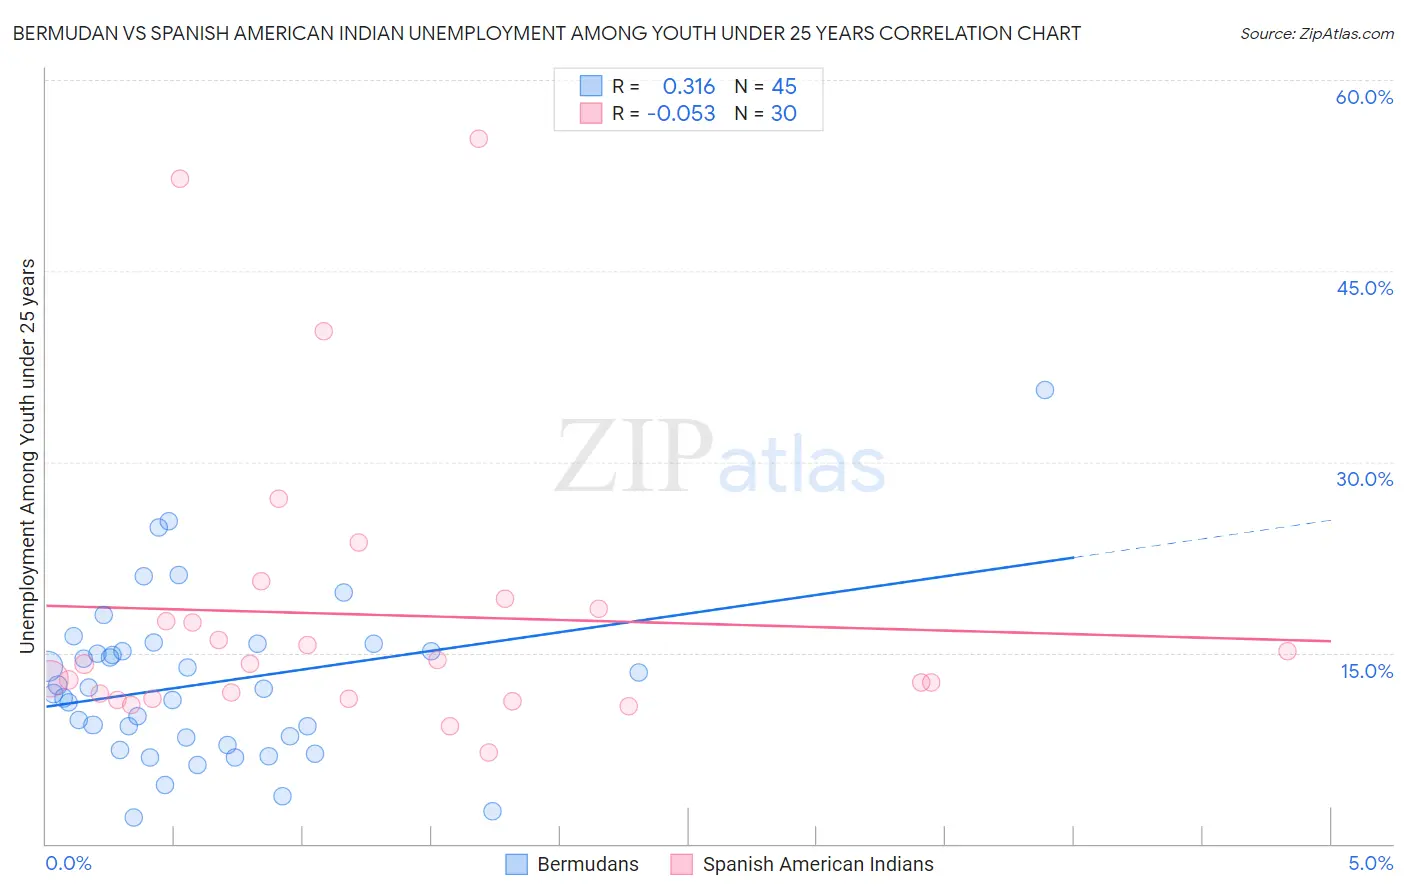
Bermudan vs Spanish American Indian Unemployment Among Youth under 25 years Correlation Chart
The statistical analysis conducted on geographies consisting of 55,599,770 people shows a mild positive correlation between the proportion of Bermudans and unemployment rate among youth under the age of 25 in the United States with a correlation coefficient (R) of 0.316 and weighted average of 13.0%. Similarly, the statistical analysis conducted on geographies consisting of 73,037,062 people shows a slight negative correlation between the proportion of Spanish American Indians and unemployment rate among youth under the age of 25 in the United States with a correlation coefficient (R) of -0.053 and weighted average of 13.5%, a difference of 3.3%.
Unemployment Among Youth under 25 years Correlation Summary
| Measurement | Bermudan | Spanish American Indian |
| Minimum | 2.1% | 7.2% |
| Maximum | 35.6% | 55.4% |
| Range | 33.5% | 48.2% |
| Mean | 12.6% | 18.0% |
| Median | 12.2% | 14.1% |
| Interquartile 25% (IQ1) | 8.1% | 11.4% |
| Interquartile 75% (IQ3) | 15.4% | 18.5% |
| Interquartile Range (IQR) | 7.3% | 7.0% |
| Standard Deviation (Sample) | 6.4% | 11.6% |
| Standard Deviation (Population) | 6.3% | 11.4% |
Demographics Similar to Bermudans and Spanish American Indians by Unemployment Among Youth under 25 years
In terms of unemployment among youth under 25 years, the demographic groups most similar to Bermudans are Immigrants from Nigeria (13.0%, a difference of 0.11%), Immigrants from Uzbekistan (13.1%, a difference of 0.43%), Bahamian (13.1%, a difference of 0.60%), African (13.2%, a difference of 0.85%), and Cajun (13.2%, a difference of 1.5%). Similarly, the demographic groups most similar to Spanish American Indians are Central American Indian (13.5%, a difference of 0.11%), Apache (13.5%, a difference of 0.14%), Immigrants from Caribbean (13.5%, a difference of 0.16%), Immigrants from Ecuador (13.4%, a difference of 0.40%), and Immigrants from Ghana (13.4%, a difference of 0.74%).
| Demographics | Rating | Rank | Unemployment Among Youth under 25 years |
| Immigrants | Nigeria | 0.0 /100 | #274 | Tragic 13.0% |
| Bermudans | 0.0 /100 | #275 | Tragic 13.0% |
| Immigrants | Uzbekistan | 0.0 /100 | #276 | Tragic 13.1% |
| Bahamians | 0.0 /100 | #277 | Tragic 13.1% |
| Africans | 0.0 /100 | #278 | Tragic 13.2% |
| Cajuns | 0.0 /100 | #279 | Tragic 13.2% |
| Ute | 0.0 /100 | #280 | Tragic 13.3% |
| Armenians | 0.0 /100 | #281 | Tragic 13.3% |
| Sierra Leoneans | 0.0 /100 | #282 | Tragic 13.3% |
| Immigrants | Cameroon | 0.0 /100 | #283 | Tragic 13.3% |
| Lumbee | 0.0 /100 | #284 | Tragic 13.3% |
| Ghanaians | 0.0 /100 | #285 | Tragic 13.3% |
| Blackfeet | 0.0 /100 | #286 | Tragic 13.3% |
| Ecuadorians | 0.0 /100 | #287 | Tragic 13.3% |
| Immigrants | Western Africa | 0.0 /100 | #288 | Tragic 13.4% |
| Immigrants | Ghana | 0.0 /100 | #289 | Tragic 13.4% |
| Immigrants | Ecuador | 0.0 /100 | #290 | Tragic 13.4% |
| Apache | 0.0 /100 | #291 | Tragic 13.5% |
| Central American Indians | 0.0 /100 | #292 | Tragic 13.5% |
| Spanish American Indians | 0.0 /100 | #293 | Tragic 13.5% |
| Immigrants | Caribbean | 0.0 /100 | #294 | Tragic 13.5% |