Belizean vs Spanish American Indian Unemployment Among Ages 65 to 74 years
COMPARE
Belizean
Spanish American Indian
Unemployment Among Ages 65 to 74 years
Unemployment Among Ages 65 to 74 years Comparison
Belizeans
Spanish American Indians
5.7%
UNEMPLOYMENT AMONG AGES 65 TO 74 YEARS
0.1/ 100
METRIC RATING
271st/ 347
METRIC RANK
5.7%
UNEMPLOYMENT AMONG AGES 65 TO 74 YEARS
0.0/ 100
METRIC RATING
290th/ 347
METRIC RANK
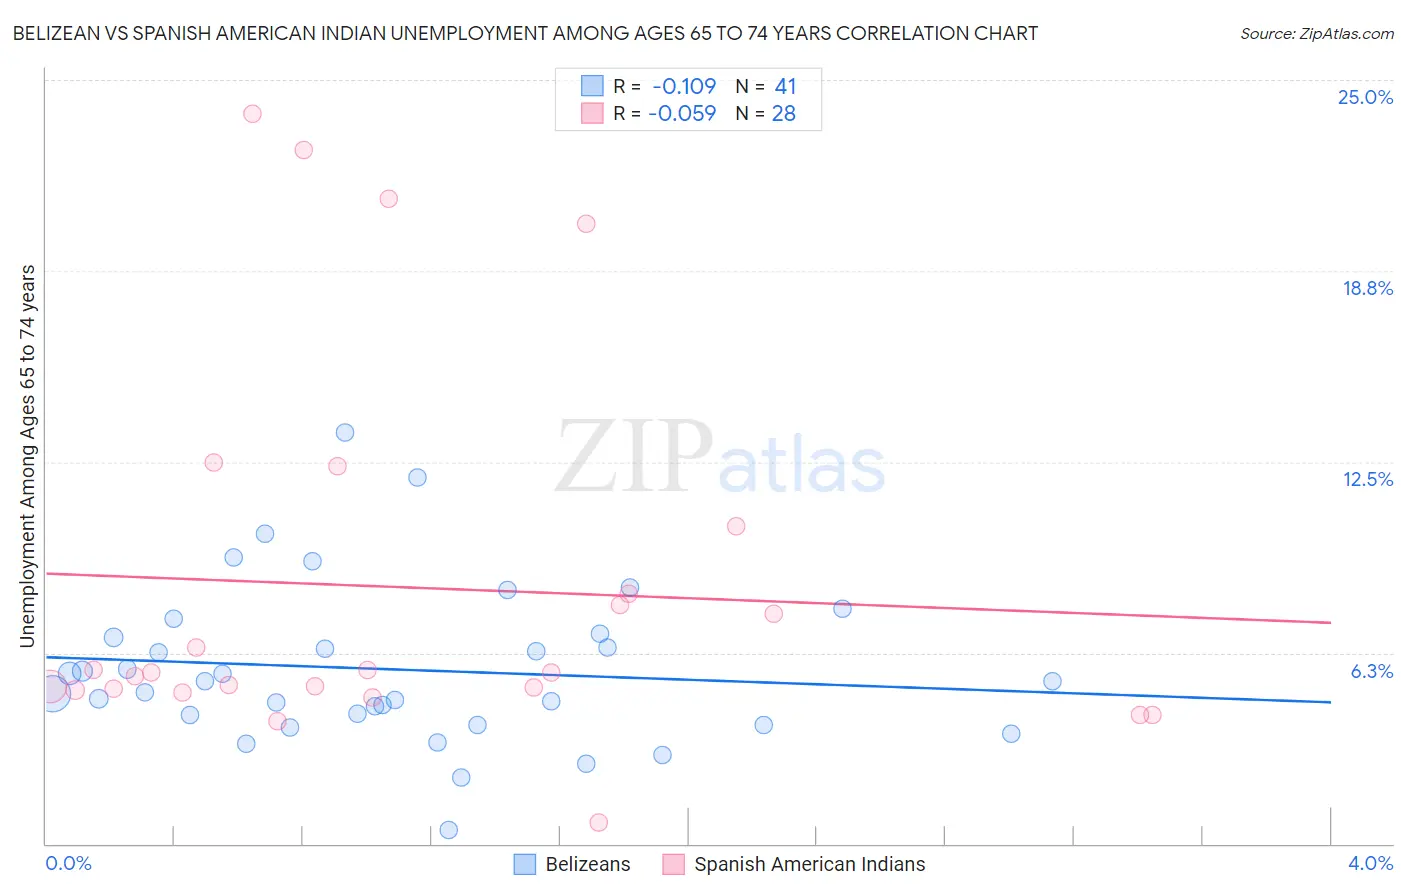
Belizean vs Spanish American Indian Unemployment Among Ages 65 to 74 years Correlation Chart
The statistical analysis conducted on geographies consisting of 137,827,369 people shows a poor negative correlation between the proportion of Belizeans and unemployment rate among population between the ages 65 and 74 in the United States with a correlation coefficient (R) of -0.109 and weighted average of 5.7%. Similarly, the statistical analysis conducted on geographies consisting of 71,305,670 people shows a slight negative correlation between the proportion of Spanish American Indians and unemployment rate among population between the ages 65 and 74 in the United States with a correlation coefficient (R) of -0.059 and weighted average of 5.7%, a difference of 1.5%.
Unemployment Among Ages 65 to 74 years Correlation Summary
| Measurement | Belizean | Spanish American Indian |
| Minimum | 0.46% | 0.70% |
| Maximum | 13.5% | 23.9% |
| Range | 13.0% | 23.2% |
| Mean | 5.7% | 8.4% |
| Median | 5.3% | 5.6% |
| Interquartile 25% (IQ1) | 4.1% | 5.1% |
| Interquartile 75% (IQ3) | 6.8% | 9.3% |
| Interquartile Range (IQR) | 2.8% | 4.2% |
| Standard Deviation (Sample) | 2.6% | 6.2% |
| Standard Deviation (Population) | 2.6% | 6.1% |
Demographics Similar to Belizeans and Spanish American Indians by Unemployment Among Ages 65 to 74 years
In terms of unemployment among ages 65 to 74 years, the demographic groups most similar to Belizeans are Yaqui (5.7%, a difference of 0.020%), Immigrants from Nigeria (5.7%, a difference of 0.030%), Bahamian (5.7%, a difference of 0.040%), Immigrants from Guyana (5.7%, a difference of 0.060%), and Immigrants from Liberia (5.7%, a difference of 0.10%). Similarly, the demographic groups most similar to Spanish American Indians are Central American (5.7%, a difference of 0.26%), Immigrants from Somalia (5.7%, a difference of 0.26%), Central American Indian (5.7%, a difference of 0.70%), Marshallese (5.7%, a difference of 0.78%), and Immigrants from Sierra Leone (5.7%, a difference of 0.81%).
| Demographics | Rating | Rank | Unemployment Among Ages 65 to 74 years |
| Immigrants | Nigeria | 0.1 /100 | #270 | Tragic 5.7% |
| Belizeans | 0.1 /100 | #271 | Tragic 5.7% |
| Yaqui | 0.1 /100 | #272 | Tragic 5.7% |
| Bahamians | 0.1 /100 | #273 | Tragic 5.7% |
| Immigrants | Guyana | 0.1 /100 | #274 | Tragic 5.7% |
| Immigrants | Liberia | 0.1 /100 | #275 | Tragic 5.7% |
| Somalis | 0.1 /100 | #276 | Tragic 5.7% |
| Immigrants | South America | 0.1 /100 | #277 | Tragic 5.7% |
| Mexican American Indians | 0.1 /100 | #278 | Tragic 5.7% |
| Immigrants | Norway | 0.1 /100 | #279 | Tragic 5.7% |
| Moroccans | 0.1 /100 | #280 | Tragic 5.7% |
| Immigrants | West Indies | 0.1 /100 | #281 | Tragic 5.7% |
| Ottawa | 0.1 /100 | #282 | Tragic 5.7% |
| Cypriots | 0.1 /100 | #283 | Tragic 5.7% |
| Chippewa | 0.1 /100 | #284 | Tragic 5.7% |
| Immigrants | Sierra Leone | 0.1 /100 | #285 | Tragic 5.7% |
| Marshallese | 0.1 /100 | #286 | Tragic 5.7% |
| Central American Indians | 0.0 /100 | #287 | Tragic 5.7% |
| Central Americans | 0.0 /100 | #288 | Tragic 5.7% |
| Immigrants | Somalia | 0.0 /100 | #289 | Tragic 5.7% |
| Spanish American Indians | 0.0 /100 | #290 | Tragic 5.7% |