Belizean vs Immigrants from Albania Unemployment Among Ages 65 to 74 years
COMPARE
Belizean
Immigrants from Albania
Unemployment Among Ages 65 to 74 years
Unemployment Among Ages 65 to 74 years Comparison
Belizeans
Immigrants from Albania
5.7%
UNEMPLOYMENT AMONG AGES 65 TO 74 YEARS
0.1/ 100
METRIC RATING
271st/ 347
METRIC RANK
5.5%
UNEMPLOYMENT AMONG AGES 65 TO 74 YEARS
3.7/ 100
METRIC RATING
227th/ 347
METRIC RANK
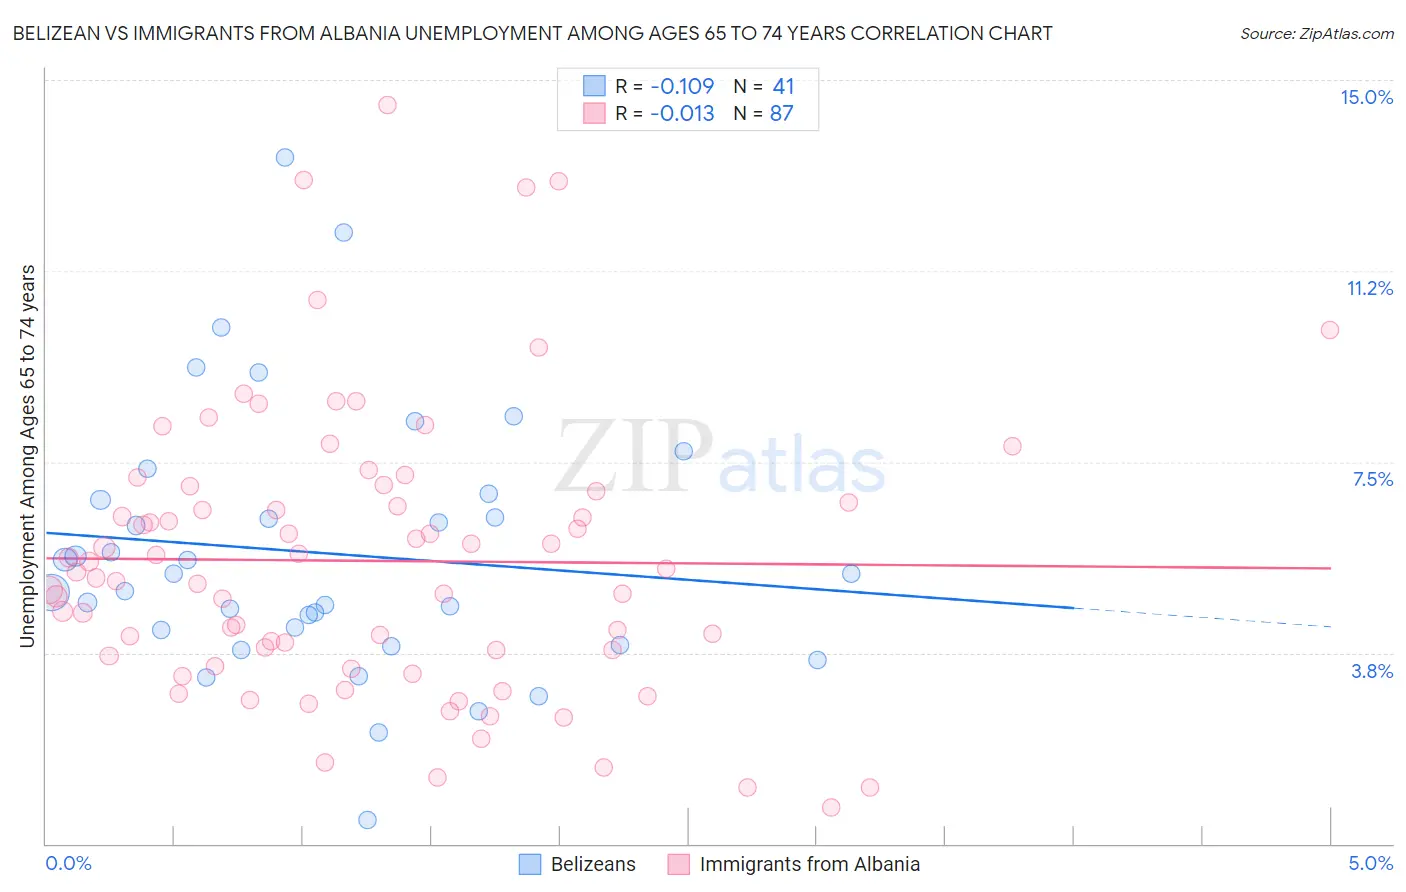
Belizean vs Immigrants from Albania Unemployment Among Ages 65 to 74 years Correlation Chart
The statistical analysis conducted on geographies consisting of 137,827,369 people shows a poor negative correlation between the proportion of Belizeans and unemployment rate among population between the ages 65 and 74 in the United States with a correlation coefficient (R) of -0.109 and weighted average of 5.7%. Similarly, the statistical analysis conducted on geographies consisting of 114,150,283 people shows no correlation between the proportion of Immigrants from Albania and unemployment rate among population between the ages 65 and 74 in the United States with a correlation coefficient (R) of -0.013 and weighted average of 5.5%, a difference of 2.7%.
Unemployment Among Ages 65 to 74 years Correlation Summary
| Measurement | Belizean | Immigrants from Albania |
| Minimum | 0.46% | 0.70% |
| Maximum | 13.5% | 14.5% |
| Range | 13.0% | 13.8% |
| Mean | 5.7% | 5.6% |
| Median | 5.3% | 5.3% |
| Interquartile 25% (IQ1) | 4.1% | 3.7% |
| Interquartile 75% (IQ3) | 6.8% | 6.9% |
| Interquartile Range (IQR) | 2.8% | 3.2% |
| Standard Deviation (Sample) | 2.6% | 2.8% |
| Standard Deviation (Population) | 2.6% | 2.8% |
Similar Demographics by Unemployment Among Ages 65 to 74 years
Demographics Similar to Belizeans by Unemployment Among Ages 65 to 74 years
In terms of unemployment among ages 65 to 74 years, the demographic groups most similar to Belizeans are Yaqui (5.7%, a difference of 0.020%), Immigrants from Nigeria (5.7%, a difference of 0.030%), Bahamian (5.7%, a difference of 0.040%), Immigrants from Colombia (5.7%, a difference of 0.050%), and Immigrants from Guyana (5.7%, a difference of 0.060%).
| Demographics | Rating | Rank | Unemployment Among Ages 65 to 74 years |
| Pueblo | 0.2 /100 | #264 | Tragic 5.6% |
| Jamaicans | 0.2 /100 | #265 | Tragic 5.6% |
| French Canadians | 0.2 /100 | #266 | Tragic 5.6% |
| Guyanese | 0.2 /100 | #267 | Tragic 5.6% |
| Hawaiians | 0.2 /100 | #268 | Tragic 5.7% |
| Immigrants | Colombia | 0.1 /100 | #269 | Tragic 5.7% |
| Immigrants | Nigeria | 0.1 /100 | #270 | Tragic 5.7% |
| Belizeans | 0.1 /100 | #271 | Tragic 5.7% |
| Yaqui | 0.1 /100 | #272 | Tragic 5.7% |
| Bahamians | 0.1 /100 | #273 | Tragic 5.7% |
| Immigrants | Guyana | 0.1 /100 | #274 | Tragic 5.7% |
| Immigrants | Liberia | 0.1 /100 | #275 | Tragic 5.7% |
| Somalis | 0.1 /100 | #276 | Tragic 5.7% |
| Immigrants | South America | 0.1 /100 | #277 | Tragic 5.7% |
| Mexican American Indians | 0.1 /100 | #278 | Tragic 5.7% |
Demographics Similar to Immigrants from Albania by Unemployment Among Ages 65 to 74 years
In terms of unemployment among ages 65 to 74 years, the demographic groups most similar to Immigrants from Albania are Honduran (5.5%, a difference of 0.0%), Immigrants from Trinidad and Tobago (5.5%, a difference of 0.090%), Immigrants from Uruguay (5.5%, a difference of 0.10%), Hungarian (5.5%, a difference of 0.15%), and Apache (5.5%, a difference of 0.16%).
| Demographics | Rating | Rank | Unemployment Among Ages 65 to 74 years |
| Immigrants | Syria | 5.1 /100 | #220 | Tragic 5.5% |
| Spaniards | 4.8 /100 | #221 | Tragic 5.5% |
| Apache | 4.5 /100 | #222 | Tragic 5.5% |
| Hungarians | 4.4 /100 | #223 | Tragic 5.5% |
| Immigrants | Uruguay | 4.2 /100 | #224 | Tragic 5.5% |
| Immigrants | Trinidad and Tobago | 4.1 /100 | #225 | Tragic 5.5% |
| Hondurans | 3.7 /100 | #226 | Tragic 5.5% |
| Immigrants | Albania | 3.7 /100 | #227 | Tragic 5.5% |
| Immigrants | Israel | 3.0 /100 | #228 | Tragic 5.5% |
| West Indians | 2.7 /100 | #229 | Tragic 5.5% |
| Immigrants | Caribbean | 2.7 /100 | #230 | Tragic 5.5% |
| Israelis | 2.5 /100 | #231 | Tragic 5.5% |
| Nigerians | 2.5 /100 | #232 | Tragic 5.5% |
| South American Indians | 2.3 /100 | #233 | Tragic 5.5% |
| French American Indians | 2.2 /100 | #234 | Tragic 5.5% |