Basque vs Australian Unemployment Among Seniors over 65 years
COMPARE
Basque
Australian
Unemployment Among Seniors over 65 years
Unemployment Among Seniors over 65 years Comparison
Basques
Australians
5.1%
UNEMPLOYMENT AMONG SENIORS OVER 65 YEARS
72.9/ 100
METRIC RATING
155th/ 347
METRIC RANK
5.1%
UNEMPLOYMENT AMONG SENIORS OVER 65 YEARS
87.1/ 100
METRIC RATING
128th/ 347
METRIC RANK
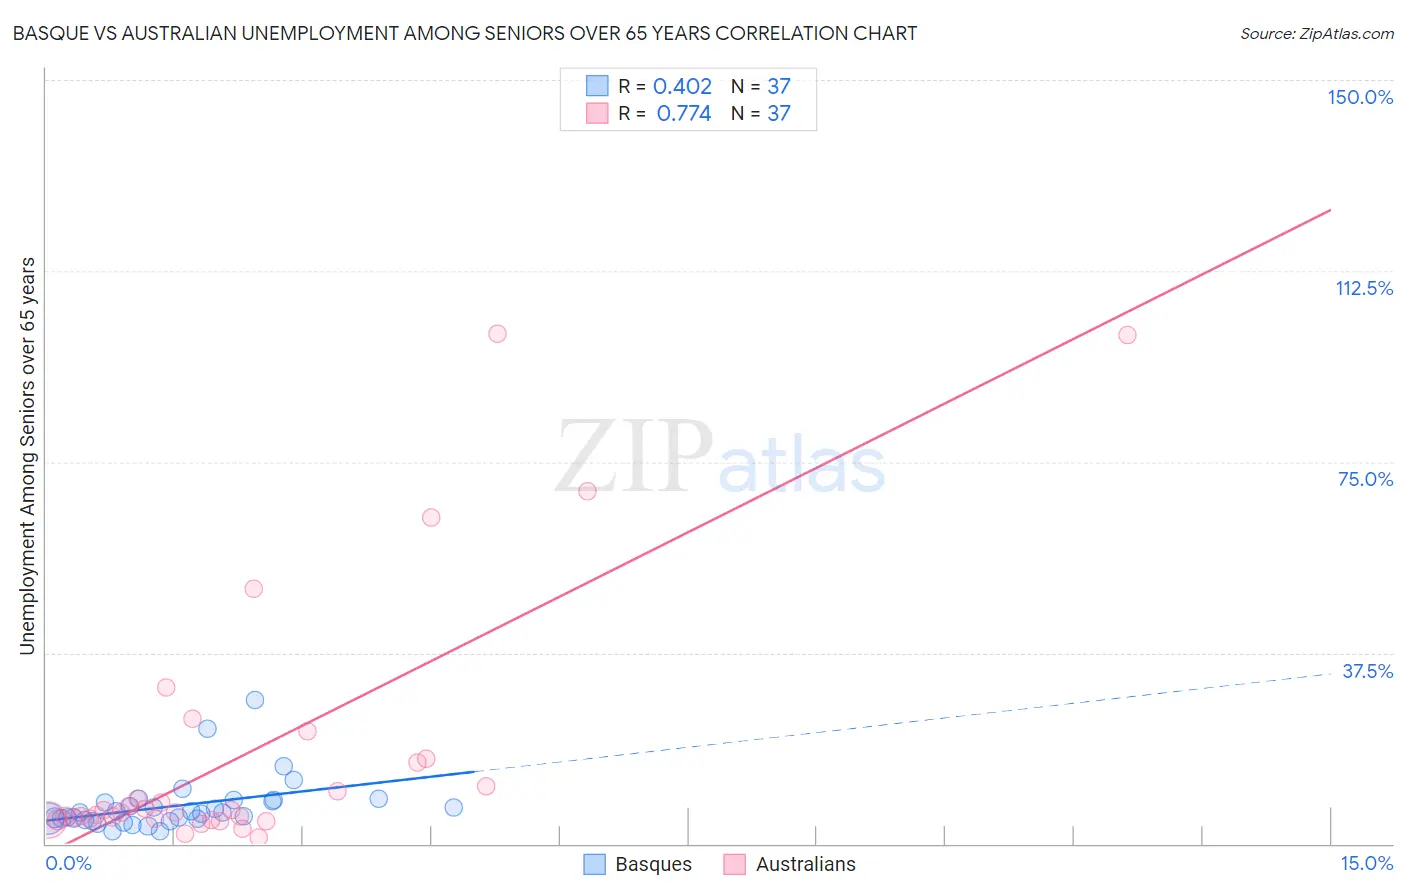
Basque vs Australian Unemployment Among Seniors over 65 years Correlation Chart
The statistical analysis conducted on geographies consisting of 157,573,567 people shows a moderate positive correlation between the proportion of Basques and unemployment rate amomg seniors over the age of 65 in the United States with a correlation coefficient (R) of 0.402 and weighted average of 5.1%. Similarly, the statistical analysis conducted on geographies consisting of 209,358,697 people shows a strong positive correlation between the proportion of Australians and unemployment rate amomg seniors over the age of 65 in the United States with a correlation coefficient (R) of 0.774 and weighted average of 5.1%, a difference of 0.75%.
Unemployment Among Seniors over 65 years Correlation Summary
| Measurement | Basque | Australian |
| Minimum | 2.4% | 1.3% |
| Maximum | 28.2% | 100.1% |
| Range | 25.8% | 98.8% |
| Mean | 7.4% | 17.5% |
| Median | 6.1% | 6.3% |
| Interquartile 25% (IQ1) | 4.8% | 4.8% |
| Interquartile 75% (IQ3) | 8.5% | 16.3% |
| Interquartile Range (IQR) | 3.7% | 11.4% |
| Standard Deviation (Sample) | 5.1% | 25.6% |
| Standard Deviation (Population) | 5.0% | 25.3% |
Similar Demographics by Unemployment Among Seniors over 65 years
Demographics Similar to Basques by Unemployment Among Seniors over 65 years
In terms of unemployment among seniors over 65 years, the demographic groups most similar to Basques are Immigrants from Romania (5.1%, a difference of 0.020%), Immigrants from Hong Kong (5.1%, a difference of 0.050%), Immigrants from Czechoslovakia (5.1%, a difference of 0.070%), Canadian (5.1%, a difference of 0.080%), and Immigrants from Asia (5.1%, a difference of 0.11%).
| Demographics | Rating | Rank | Unemployment Among Seniors over 65 years |
| Greeks | 77.0 /100 | #148 | Good 5.1% |
| Immigrants | Afghanistan | 76.8 /100 | #149 | Good 5.1% |
| Immigrants | Asia | 75.6 /100 | #150 | Good 5.1% |
| Pakistanis | 75.5 /100 | #151 | Good 5.1% |
| Canadians | 74.7 /100 | #152 | Good 5.1% |
| Immigrants | Czechoslovakia | 74.5 /100 | #153 | Good 5.1% |
| Immigrants | Hong Kong | 74.0 /100 | #154 | Good 5.1% |
| Basques | 72.9 /100 | #155 | Good 5.1% |
| Immigrants | Romania | 72.4 /100 | #156 | Good 5.1% |
| Immigrants | Northern Europe | 69.8 /100 | #157 | Good 5.1% |
| Immigrants | Belarus | 69.0 /100 | #158 | Good 5.1% |
| Immigrants | France | 68.6 /100 | #159 | Good 5.1% |
| French | 68.1 /100 | #160 | Good 5.1% |
| Immigrants | Bosnia and Herzegovina | 66.1 /100 | #161 | Good 5.1% |
| Immigrants | South Eastern Asia | 65.6 /100 | #162 | Good 5.1% |
Demographics Similar to Australians by Unemployment Among Seniors over 65 years
In terms of unemployment among seniors over 65 years, the demographic groups most similar to Australians are Immigrants from Sri Lanka (5.1%, a difference of 0.020%), Sri Lankan (5.1%, a difference of 0.020%), Immigrants from England (5.1%, a difference of 0.030%), Dutch (5.1%, a difference of 0.040%), and Iranian (5.1%, a difference of 0.040%).
| Demographics | Rating | Rank | Unemployment Among Seniors over 65 years |
| Puget Sound Salish | 88.7 /100 | #121 | Excellent 5.1% |
| Immigrants | Cameroon | 88.6 /100 | #122 | Excellent 5.1% |
| Asians | 88.5 /100 | #123 | Excellent 5.1% |
| Immigrants | North America | 87.9 /100 | #124 | Excellent 5.1% |
| Dutch | 87.6 /100 | #125 | Excellent 5.1% |
| Immigrants | Sri Lanka | 87.4 /100 | #126 | Excellent 5.1% |
| Sri Lankans | 87.4 /100 | #127 | Excellent 5.1% |
| Australians | 87.1 /100 | #128 | Excellent 5.1% |
| Immigrants | England | 86.7 /100 | #129 | Excellent 5.1% |
| Iranians | 86.6 /100 | #130 | Excellent 5.1% |
| Immigrants | Australia | 85.8 /100 | #131 | Excellent 5.1% |
| Chileans | 85.6 /100 | #132 | Excellent 5.1% |
| Syrians | 85.3 /100 | #133 | Excellent 5.1% |
| Turks | 84.9 /100 | #134 | Excellent 5.1% |
| Ukrainians | 84.4 /100 | #135 | Excellent 5.1% |