Armenian vs Australian Unemployment Among Seniors over 65 years

COMPARE

Armenian
Race
Ancestry
AfghanAfricanAlaska NativeAlaskan AthabascanAlbanianAleutAlsatianAmericanApacheArabArapahoArgentineanArmenianAssyrian/Chaldean/SyriacAustrianBahamianBangladeshiBarbadianBasqueBelgianBelizeanBermudanBhutaneseBlackfeetBolivianBrazilianBritishBritish West IndianBulgarianBurmeseCajunCambodianCanadianCape VerdeanCarpatho RusynCelticCentral AmericanCentral American IndianCherokeeCheyenneChickasawChileanChineseChippewaChoctawColombianColvilleComancheCosta RicanCreeCreekCroatianCrowCubanCypriotCzechCzechoslovakianDanishDelawareDominicanDutchDutch West IndianEastern EuropeanEcuadorianEgyptianEnglishEstonianEthiopianEuropeanFijianFilipinoFinnishFrenchFrench American IndianFrench CanadianGermanGerman RussianGhanaianGreekGuamanian/ChamorroGuatemalanGuyaneseHaitianHmongHonduranHopiHoumaHungarianIcelanderIndian (Asian)IndonesianInupiatIranianIraqiIrishIroquoisIsraeliItalianJamaicanJapaneseJordanianKenyanKiowaKoreanLaotianLatvianLebaneseLiberianLithuanianLumbeeLuxembourgerMacedonianMalaysianMalteseMarshalleseMenomineeMexicanMexican American IndianMongolianMoroccanNative HawaiianNavajoNepaleseNew ZealanderNicaraguanNigerianNorthern EuropeanNorwegianOkinawanOsageOttawaPaiutePakistaniPalestinianPanamanianParaguayanPennsylvania GermanPeruvianPimaPolishPortuguesePotawatomiPuebloPuerto RicanPuget Sound SalishRomanianRussianSalvadoranSamoanScandinavianScotch-IrishScottishSeminoleSenegaleseSerbianShoshoneSierra LeoneanSiouxSlavicSlovakSloveneSomaliSouth AfricanSouth AmericanSouth American IndianSoviet UnionSpaniardSpanishSpanish AmericanSpanish American IndianSri LankanSubsaharan AfricanSudaneseSwedishSwissSyrianTaiwaneseThaiTlingit-HaidaTohono O'OdhamTonganTrinidadian and TobagonianTsimshianTurkishU.S. Virgin IslanderUgandanUkrainianUruguayanUteVenezuelanVietnameseWelshWest IndianYakamaYaquiYugoslavianYumanYup'ikZimbabwean
Immigration
NonimmigrantsImmigrantsAfghanistanAfricaAlbaniaArgentinaArmeniaAsiaAustraliaAustriaBahamasBangladeshBarbadosBelarusBelgiumBelizeBoliviaBosnia and HerzegovinaBrazilBulgariaBurma/MyanmarCabo VerdeCambodiaCameroonCanadaCaribbeanCentral AmericaChileChinaColombiaCongoCosta RicaCroatiaCubaCzechoslovakiaDenmarkDominicaDominican RepublicEastern AfricaEastern AsiaEastern EuropeEcuadorEgyptEl SalvadorEnglandEritreaEthiopiaEuropeFijiFranceGermanyGhanaGreeceGrenadaGuatemalaGuyanaHaitiHondurasHong KongHungaryIndiaIndonesiaIranIraqIrelandIsraelItalyJamaicaJapanJordanKazakhstanKenyaKoreaKuwaitLaosLatin AmericaLatviaLebanonLiberiaLithuaniaMalaysiaMexicoMicronesiaMiddle AfricaMoldovaMoroccoNepalNetherlandsNicaraguaNigeriaNorth AmericaNorth MacedoniaNorthern AfricaNorthern EuropeNorwayOceaniaPakistanPanamaPeruPhilippinesPolandPortugalRomaniaRussiaSaudi ArabiaScotlandSenegalSerbiaSierra LeoneSingaporeSomaliaSouth AfricaSouth AmericaSouth Central AsiaSouth Eastern AsiaSouthern EuropeSpainSri LankaSt. Vincent and the GrenadinesSudanSwedenSwitzerlandSyriaTaiwanThailandTrinidad and TobagoTurkeyUgandaUkraineUruguayUzbekistanVenezuelaVietnamWest IndiesWestern AfricaWestern AsiaWestern EuropeYemenZaireZimbabweAzores
Australian
Race
Ancestry
AfghanAfricanAlaska NativeAlaskan AthabascanAlbanianAleutAlsatianAmericanApacheArabArapahoArgentineanAssyrian/Chaldean/SyriacAustralianAustrianBahamianBangladeshiBarbadianBasqueBelgianBelizeanBermudanBhutaneseBlackfeetBolivianBrazilianBritishBritish West IndianBulgarianBurmeseCajunCambodianCanadianCape VerdeanCarpatho RusynCelticCentral AmericanCentral American IndianCherokeeCheyenneChickasawChileanChineseChippewaChoctawColombianColvilleComancheCosta RicanCreeCreekCroatianCrowCubanCypriotCzechCzechoslovakianDanishDelawareDominicanDutchDutch West IndianEastern EuropeanEcuadorianEgyptianEnglishEstonianEthiopianEuropeanFijianFilipinoFinnishFrenchFrench American IndianFrench CanadianGermanGerman RussianGhanaianGreekGuamanian/ChamorroGuatemalanGuyaneseHaitianHmongHonduranHopiHoumaHungarianIcelanderIndian (Asian)IndonesianInupiatIranianIraqiIrishIroquoisIsraeliItalianJamaicanJapaneseJordanianKenyanKiowaKoreanLaotianLatvianLebaneseLiberianLithuanianLumbeeLuxembourgerMacedonianMalaysianMalteseMarshalleseMenomineeMexicanMexican American IndianMongolianMoroccanNative HawaiianNavajoNepaleseNew ZealanderNicaraguanNigerianNorthern EuropeanNorwegianOkinawanOsageOttawaPaiutePakistaniPalestinianPanamanianParaguayanPennsylvania GermanPeruvianPimaPolishPortuguesePotawatomiPuebloPuerto RicanPuget Sound SalishRomanianRussianSalvadoranSamoanScandinavianScotch-IrishScottishSeminoleSenegaleseSerbianShoshoneSierra LeoneanSiouxSlavicSlovakSloveneSomaliSouth AfricanSouth AmericanSouth American IndianSoviet UnionSpaniardSpanishSpanish AmericanSpanish American IndianSri LankanSubsaharan AfricanSudaneseSwedishSwissSyrianTaiwaneseThaiTlingit-HaidaTohono O'OdhamTonganTrinidadian and TobagonianTsimshianTurkishU.S. Virgin IslanderUgandanUkrainianUruguayanUteVenezuelanVietnameseWelshWest IndianYakamaYaquiYugoslavianYumanYup'ikZimbabwean
Immigration
NonimmigrantsImmigrantsAfghanistanAfricaAlbaniaArgentinaArmeniaAsiaAustraliaAustriaBahamasBangladeshBarbadosBelarusBelgiumBelizeBoliviaBosnia and HerzegovinaBrazilBulgariaBurma/MyanmarCabo VerdeCambodiaCameroonCanadaCaribbeanCentral AmericaChileChinaColombiaCongoCosta RicaCroatiaCubaCzechoslovakiaDenmarkDominicaDominican RepublicEastern AfricaEastern AsiaEastern EuropeEcuadorEgyptEl SalvadorEnglandEritreaEthiopiaEuropeFijiFranceGermanyGhanaGreeceGrenadaGuatemalaGuyanaHaitiHondurasHong KongHungaryIndiaIndonesiaIranIraqIrelandIsraelItalyJamaicaJapanJordanKazakhstanKenyaKoreaKuwaitLaosLatin AmericaLatviaLebanonLiberiaLithuaniaMalaysiaMexicoMicronesiaMiddle AfricaMoldovaMoroccoNepalNetherlandsNicaraguaNigeriaNorth AmericaNorth MacedoniaNorthern AfricaNorthern EuropeNorwayOceaniaPakistanPanamaPeruPhilippinesPolandPortugalRomaniaRussiaSaudi ArabiaScotlandSenegalSerbiaSierra LeoneSingaporeSomaliaSouth AfricaSouth AmericaSouth Central AsiaSouth Eastern AsiaSouthern EuropeSpainSri LankaSt. Vincent and the GrenadinesSudanSwedenSwitzerlandSyriaTaiwanThailandTrinidad and TobagoTurkeyUgandaUkraineUruguayUzbekistanVenezuelaVietnamWest IndiesWestern AfricaWestern AsiaWestern EuropeYemenZaireZimbabweAzores
Unemployment Among Seniors over 65 years
Income
Poverty
Unemployment
Labor Participation
Family Structure
Vehicle Availability
Education Level
Disability

Unemployment Among Seniors over 65 years Comparison

Armenians

Australians

Tragic
Excellent
5.5%
UNEMPLOYMENT AMONG SENIORS OVER 65 YEARS
0.0/ 100
METRIC RATING
294th/ 347
METRIC RANK
5.1%
UNEMPLOYMENT AMONG SENIORS OVER 65 YEARS
87.1/ 100
METRIC RATING
128th/ 347
METRIC RANK

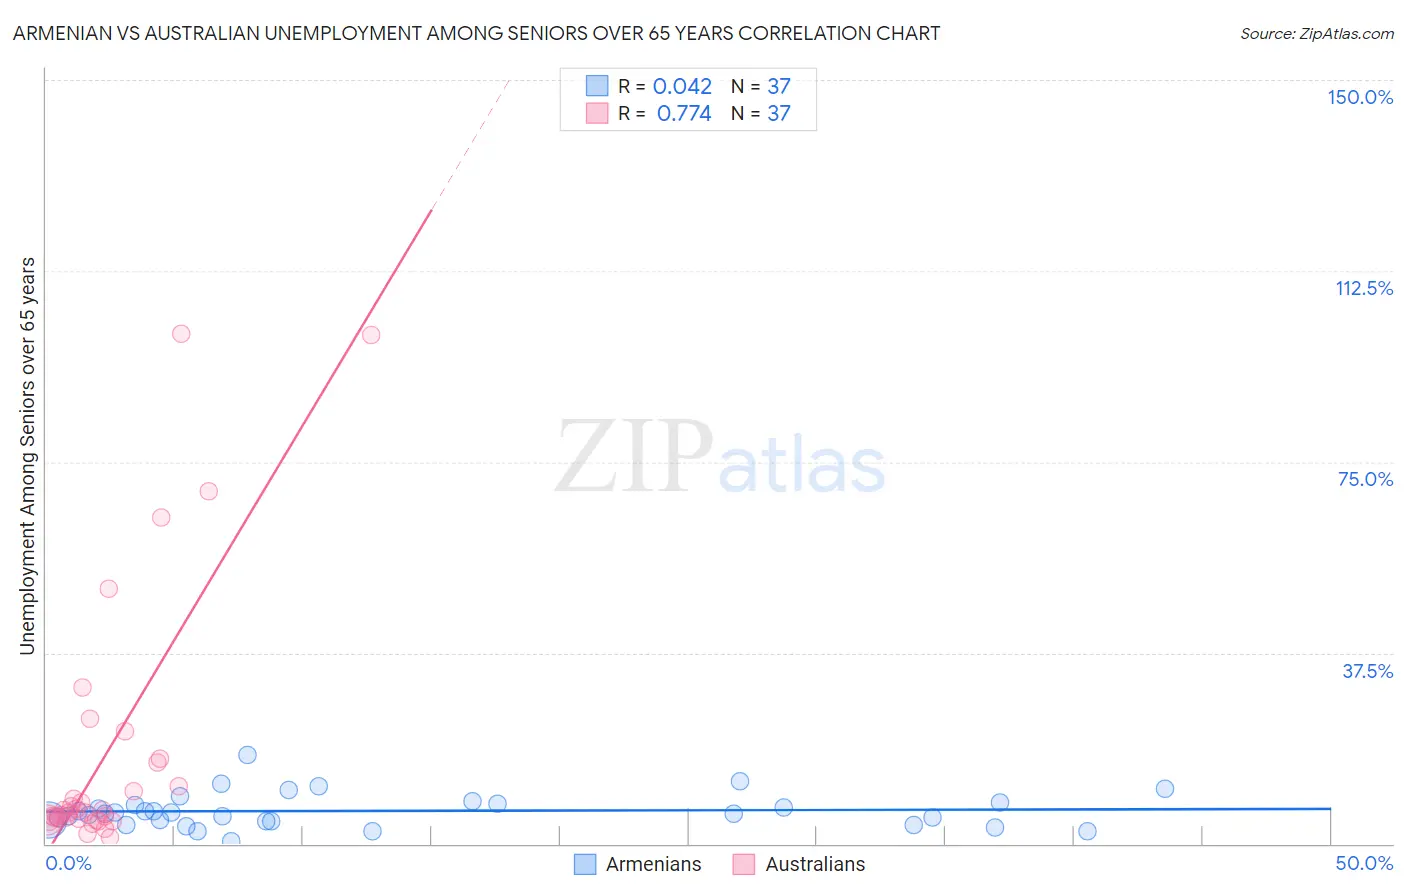
Armenian vs Australian Unemployment Among Seniors over 65 years Correlation Chart

The statistical analysis conducted on geographies consisting of 288,828,346 people shows no correlation between the proportion of Armenians and unemployment rate amomg seniors over the age of 65 in the United States with a correlation coefficient (R) of 0.042 and weighted average of 5.5%. Similarly, the statistical analysis conducted on geographies consisting of 209,358,697 people shows a strong positive correlation between the proportion of Australians and unemployment rate amomg seniors over the age of 65 in the United States with a correlation coefficient (R) of 0.774 and weighted average of 5.1%, a difference of 9.3%.
Armenian vs Australian Unemployment Among Seniors over 65 years

Unemployment Among Seniors over 65 years Correlation Summary

MeasurementArmenianAustralian
Minimum0.50%1.3%
Maximum17.4%100.1%
Range16.9%98.8%
Mean6.4%17.5%
Median5.8%6.3%
Interquartile 25% (IQ1)4.5%4.8%
Interquartile 75% (IQ3)7.9%16.3%
Interquartile Range (IQR)3.4%11.4%
Standard Deviation (Sample)3.3%25.6%
Standard Deviation (Population)3.3%25.3%

Similar Demographics by Unemployment Among Seniors over 65 years

Demographics Similar to Armenians by Unemployment Among Seniors over 65 years

In terms of unemployment among seniors over 65 years, the demographic groups most similar to Armenians are Immigrants from Venezuela (5.5%, a difference of 0.040%), Cheyenne (5.5%, a difference of 0.070%), Belizean (5.5%, a difference of 0.080%), Cape Verdean (5.5%, a difference of 0.080%), and Yaqui (5.5%, a difference of 0.090%).
DemographicsRating | RankUnemployment Among Seniors over 65 years
Venezuelans
0.0
/100
|
#287
Tragic
5.5%
U.S. Virgin Islanders
0.0
/100
|
#288
Tragic
5.5%
Immigrants | Cabo Verde
0.0
/100
|
#289
Tragic
5.5%
Jamaicans
0.0
/100
|
#290
Tragic
5.5%
Blacks/African Americans
0.0
/100
|
#291
Tragic
5.5%
Belizeans
0.0
/100
|
#292
Tragic
5.5%
Immigrants | Venezuela
0.0
/100
|
#293
Tragic
5.5%
Armenians
0.0
/100
|
#294
Tragic
5.5%
Cheyenne
0.0
/100
|
#295
Tragic
5.5%
Cape Verdeans
0.0
/100
|
#296
Tragic
5.5%
Yaqui
0.0
/100
|
#297
Tragic
5.5%
Immigrants | West Indies
0.0
/100
|
#298
Tragic
5.6%
Guyanese
0.0
/100
|
#299
Tragic
5.6%
Zimbabweans
0.0
/100
|
#300
Tragic
5.6%
Hispanics or Latinos
0.0
/100
|
#301
Tragic
5.6%

Demographics Similar to Australians by Unemployment Among Seniors over 65 years

In terms of unemployment among seniors over 65 years, the demographic groups most similar to Australians are Immigrants from Sri Lanka (5.1%, a difference of 0.020%), Sri Lankan (5.1%, a difference of 0.020%), Immigrants from England (5.1%, a difference of 0.030%), Dutch (5.1%, a difference of 0.040%), and Iranian (5.1%, a difference of 0.040%).
DemographicsRating | RankUnemployment Among Seniors over 65 years
Puget Sound Salish
88.7
/100
|
#121
Excellent
5.1%
Immigrants | Cameroon
88.6
/100
|
#122
Excellent
5.1%
Asians
88.5
/100
|
#123
Excellent
5.1%
Immigrants | North America
87.9
/100
|
#124
Excellent
5.1%
Dutch
87.6
/100
|
#125
Excellent
5.1%
Immigrants | Sri Lanka
87.4
/100
|
#126
Excellent
5.1%
Sri Lankans
87.4
/100
|
#127
Excellent
5.1%
Australians
87.1
/100
|
#128
Excellent
5.1%
Immigrants | England
86.7
/100
|
#129
Excellent
5.1%
Iranians
86.6
/100
|
#130
Excellent
5.1%
Immigrants | Australia
85.8
/100
|
#131
Excellent
5.1%
Chileans
85.6
/100
|
#132
Excellent
5.1%
Syrians
85.3
/100
|
#133
Excellent
5.1%
Turks
84.9
/100
|
#134
Excellent
5.1%
Ukrainians
84.4
/100
|
#135
Excellent
5.1%