Australian vs Romanian Unemployment Among Ages 35 to 44 years
COMPARE
Australian
Romanian
Unemployment Among Ages 35 to 44 years
Unemployment Among Ages 35 to 44 years Comparison
Australians
Romanians
4.5%
UNEMPLOYMENT AMONG AGES 35 TO 44 YEARS
94.5/ 100
METRIC RATING
90th/ 347
METRIC RANK
4.5%
UNEMPLOYMENT AMONG AGES 35 TO 44 YEARS
90.3/ 100
METRIC RATING
109th/ 347
METRIC RANK
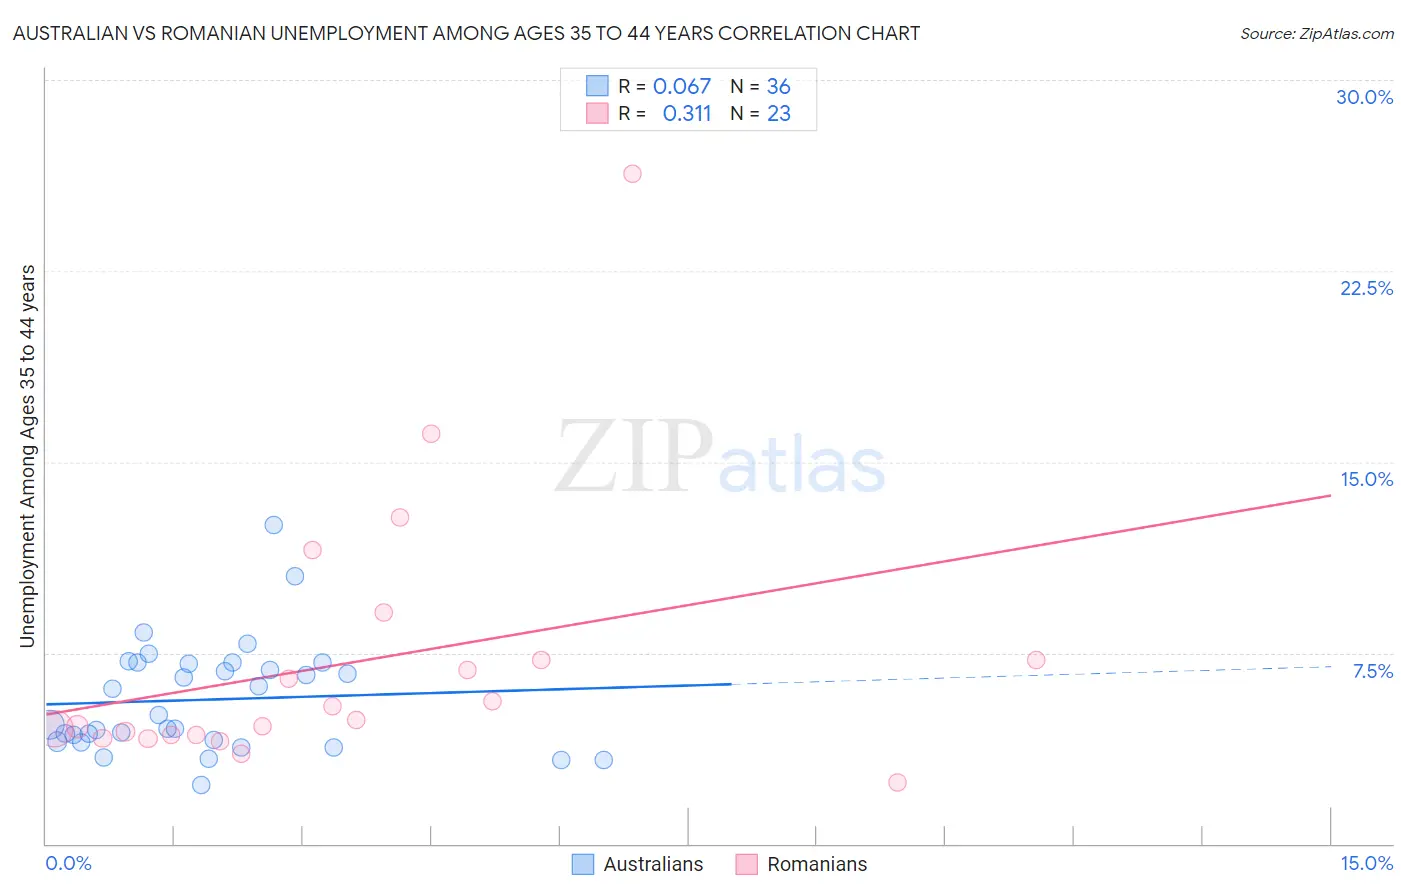
Australian vs Romanian Unemployment Among Ages 35 to 44 years Correlation Chart
The statistical analysis conducted on geographies consisting of 220,770,774 people shows a slight positive correlation between the proportion of Australians and unemployment rate among population between the ages 35 and 44 in the United States with a correlation coefficient (R) of 0.067 and weighted average of 4.5%. Similarly, the statistical analysis conducted on geographies consisting of 368,934,538 people shows a mild positive correlation between the proportion of Romanians and unemployment rate among population between the ages 35 and 44 in the United States with a correlation coefficient (R) of 0.311 and weighted average of 4.5%, a difference of 1.1%.
Unemployment Among Ages 35 to 44 years Correlation Summary
| Measurement | Australian | Romanian |
| Minimum | 2.3% | 2.4% |
| Maximum | 12.5% | 26.3% |
| Range | 10.2% | 23.9% |
| Mean | 5.7% | 7.1% |
| Median | 4.9% | 4.8% |
| Interquartile 25% (IQ1) | 4.0% | 4.3% |
| Interquartile 75% (IQ3) | 7.1% | 7.2% |
| Interquartile Range (IQR) | 3.0% | 2.9% |
| Standard Deviation (Sample) | 2.2% | 5.3% |
| Standard Deviation (Population) | 2.1% | 5.2% |
Demographics Similar to Australians and Romanians by Unemployment Among Ages 35 to 44 years
In terms of unemployment among ages 35 to 44 years, the demographic groups most similar to Australians are Egyptian (4.5%, a difference of 0.020%), Immigrants from Northern Europe (4.5%, a difference of 0.070%), Estonian (4.5%, a difference of 0.080%), Iranian (4.5%, a difference of 0.20%), and Russian (4.5%, a difference of 0.25%). Similarly, the demographic groups most similar to Romanians are New Zealander (4.5%, a difference of 0.0%), Immigrants from North Macedonia (4.5%, a difference of 0.090%), Immigrants from North America (4.5%, a difference of 0.18%), Immigrants from Saudi Arabia (4.5%, a difference of 0.22%), and Finnish (4.5%, a difference of 0.28%).
| Demographics | Rating | Rank | Unemployment Among Ages 35 to 44 years |
| Egyptians | 94.5 /100 | #89 | Exceptional 4.5% |
| Australians | 94.5 /100 | #90 | Exceptional 4.5% |
| Immigrants | Northern Europe | 94.3 /100 | #91 | Exceptional 4.5% |
| Estonians | 94.3 /100 | #92 | Exceptional 4.5% |
| Iranians | 93.9 /100 | #93 | Exceptional 4.5% |
| Russians | 93.8 /100 | #94 | Exceptional 4.5% |
| Yugoslavians | 93.6 /100 | #95 | Exceptional 4.5% |
| Scottish | 93.5 /100 | #96 | Exceptional 4.5% |
| Immigrants | France | 92.5 /100 | #97 | Exceptional 4.5% |
| Immigrants | Canada | 92.3 /100 | #98 | Exceptional 4.5% |
| Immigrants | Egypt | 92.3 /100 | #99 | Exceptional 4.5% |
| Italians | 91.9 /100 | #100 | Exceptional 4.5% |
| Immigrants | Netherlands | 91.9 /100 | #101 | Exceptional 4.5% |
| Immigrants | Sudan | 91.8 /100 | #102 | Exceptional 4.5% |
| Welsh | 91.6 /100 | #103 | Exceptional 4.5% |
| Finns | 91.6 /100 | #104 | Exceptional 4.5% |
| Immigrants | Saudi Arabia | 91.3 /100 | #105 | Exceptional 4.5% |
| Immigrants | North America | 91.1 /100 | #106 | Exceptional 4.5% |
| Immigrants | North Macedonia | 90.7 /100 | #107 | Exceptional 4.5% |
| New Zealanders | 90.3 /100 | #108 | Exceptional 4.5% |
| Romanians | 90.3 /100 | #109 | Exceptional 4.5% |