Arapaho vs Indian (Asian) Unemployment Among Ages 20 to 24 years

COMPARE

Arapaho
Race
Ancestry
AfghanAfricanAlaska NativeAlaskan AthabascanAlbanianAleutAlsatianAmericanApacheArabArapahoArgentineanArmenianAssyrian/Chaldean/SyriacAustralianAustrianBahamianBangladeshiBarbadianBasqueBelgianBelizeanBermudanBhutaneseBlackfeetBolivianBrazilianBritishBritish West IndianBulgarianBurmeseCajunCambodianCanadianCape VerdeanCarpatho RusynCelticCentral AmericanCentral American IndianCherokeeCheyenneChickasawChileanChineseChippewaChoctawColombianColvilleComancheCosta RicanCreeCreekCroatianCrowCubanCypriotCzechCzechoslovakianDanishDelawareDominicanDutchDutch West IndianEastern EuropeanEcuadorianEgyptianEnglishEstonianEthiopianEuropeanFijianFilipinoFinnishFrenchFrench American IndianFrench CanadianGermanGerman RussianGhanaianGreekGuamanian/ChamorroGuatemalanGuyaneseHaitianHmongHonduranHopiHoumaHungarianIcelanderIndonesianInupiatIranianIraqiIrishIroquoisIsraeliItalianJamaicanJapaneseJordanianKenyanKiowaKoreanLaotianLatvianLebaneseLiberianLithuanianLumbeeLuxembourgerMacedonianMalaysianMalteseMarshalleseMenomineeMexicanMexican American IndianMongolianMoroccanNative HawaiianNavajoNepaleseNew ZealanderNicaraguanNigerianNorthern EuropeanNorwegianOkinawanOsageOttawaPaiutePakistaniPalestinianPanamanianParaguayanPennsylvania GermanPeruvianPimaPolishPortuguesePotawatomiPuebloPuerto RicanPuget Sound SalishRomanianRussianSalvadoranSamoanScandinavianScotch-IrishScottishSeminoleSenegaleseSerbianShoshoneSierra LeoneanSiouxSlavicSlovakSloveneSomaliSouth AfricanSouth AmericanSouth American IndianSoviet UnionSpaniardSpanishSpanish AmericanSpanish American IndianSri LankanSubsaharan AfricanSudaneseSwedishSwissSyrianTaiwaneseThaiTlingit-HaidaTohono O'OdhamTonganTrinidadian and TobagonianTsimshianTurkishU.S. Virgin IslanderUgandanUkrainianUruguayanUteVenezuelanVietnameseWelshWest IndianYakamaYaquiYugoslavianYumanYup'ikZimbabwean
Immigration
NonimmigrantsImmigrantsAfghanistanAfricaAlbaniaArgentinaArmeniaAsiaAustraliaAustriaBahamasBangladeshBarbadosBelarusBelgiumBelizeBoliviaBosnia and HerzegovinaBrazilBulgariaBurma/MyanmarCabo VerdeCambodiaCameroonCanadaCaribbeanCentral AmericaChileChinaColombiaCongoCosta RicaCroatiaCubaCzechoslovakiaDenmarkDominicaDominican RepublicEastern AfricaEastern AsiaEastern EuropeEcuadorEgyptEl SalvadorEnglandEritreaEthiopiaEuropeFijiFranceGermanyGhanaGreeceGrenadaGuatemalaGuyanaHaitiHondurasHong KongHungaryIndiaIndonesiaIranIraqIrelandIsraelItalyJamaicaJapanJordanKazakhstanKenyaKoreaKuwaitLaosLatin AmericaLatviaLebanonLiberiaLithuaniaMalaysiaMexicoMicronesiaMiddle AfricaMoldovaMoroccoNepalNetherlandsNicaraguaNigeriaNorth AmericaNorth MacedoniaNorthern AfricaNorthern EuropeNorwayOceaniaPakistanPanamaPeruPhilippinesPolandPortugalRomaniaRussiaSaudi ArabiaScotlandSenegalSerbiaSierra LeoneSingaporeSomaliaSouth AfricaSouth AmericaSouth Central AsiaSouth Eastern AsiaSouthern EuropeSpainSri LankaSt. Vincent and the GrenadinesSudanSwedenSwitzerlandSyriaTaiwanThailandTrinidad and TobagoTurkeyUgandaUkraineUruguayUzbekistanVenezuelaVietnamWest IndiesWestern AfricaWestern AsiaWestern EuropeYemenZaireZimbabweAzores
Indian (Asian)
Race
Ancestry
AfghanAfricanAlaska NativeAlaskan AthabascanAlbanianAleutAlsatianAmericanApacheArabArgentineanArmenianAssyrian/Chaldean/SyriacAustralianAustrianBahamianBangladeshiBarbadianBasqueBelgianBelizeanBermudanBhutaneseBlackfeetBolivianBrazilianBritishBritish West IndianBulgarianBurmeseCajunCambodianCanadianCape VerdeanCarpatho RusynCelticCentral AmericanCentral American IndianCherokeeCheyenneChickasawChileanChineseChippewaChoctawColombianColvilleComancheCosta RicanCreeCreekCroatianCrowCubanCypriotCzechCzechoslovakianDanishDelawareDominicanDutchDutch West IndianEastern EuropeanEcuadorianEgyptianEnglishEstonianEthiopianEuropeanFijianFilipinoFinnishFrenchFrench American IndianFrench CanadianGermanGerman RussianGhanaianGreekGuamanian/ChamorroGuatemalanGuyaneseHaitianHmongHonduranHopiHoumaHungarianIcelanderIndian (Asian)IndonesianInupiatIranianIraqiIrishIroquoisIsraeliItalianJamaicanJapaneseJordanianKenyanKiowaKoreanLaotianLatvianLebaneseLiberianLithuanianLumbeeLuxembourgerMacedonianMalaysianMalteseMarshalleseMenomineeMexicanMexican American IndianMongolianMoroccanNative HawaiianNavajoNepaleseNew ZealanderNicaraguanNigerianNorthern EuropeanNorwegianOkinawanOsageOttawaPaiutePakistaniPalestinianPanamanianParaguayanPennsylvania GermanPeruvianPimaPolishPortuguesePotawatomiPuebloPuerto RicanPuget Sound SalishRomanianRussianSalvadoranSamoanScandinavianScotch-IrishScottishSeminoleSenegaleseSerbianShoshoneSierra LeoneanSiouxSlavicSlovakSloveneSomaliSouth AfricanSouth AmericanSouth American IndianSoviet UnionSpaniardSpanishSpanish AmericanSpanish American IndianSri LankanSubsaharan AfricanSudaneseSwedishSwissSyrianTaiwaneseThaiTlingit-HaidaTohono O'OdhamTonganTrinidadian and TobagonianTsimshianTurkishU.S. Virgin IslanderUgandanUkrainianUruguayanUteVenezuelanVietnameseWelshWest IndianYakamaYaquiYugoslavianYumanYup'ikZimbabwean
Immigration
NonimmigrantsImmigrantsAfghanistanAfricaAlbaniaArgentinaArmeniaAsiaAustraliaAustriaBahamasBangladeshBarbadosBelarusBelgiumBelizeBoliviaBosnia and HerzegovinaBrazilBulgariaBurma/MyanmarCabo VerdeCambodiaCameroonCanadaCaribbeanCentral AmericaChileChinaColombiaCongoCosta RicaCroatiaCubaCzechoslovakiaDenmarkDominicaDominican RepublicEastern AfricaEastern AsiaEastern EuropeEcuadorEgyptEl SalvadorEnglandEritreaEthiopiaEuropeFijiFranceGermanyGhanaGreeceGrenadaGuatemalaGuyanaHaitiHondurasHong KongHungaryIndiaIndonesiaIranIraqIrelandIsraelItalyJamaicaJapanJordanKazakhstanKenyaKoreaKuwaitLaosLatin AmericaLatviaLebanonLiberiaLithuaniaMalaysiaMexicoMicronesiaMiddle AfricaMoldovaMoroccoNepalNetherlandsNicaraguaNigeriaNorth AmericaNorth MacedoniaNorthern AfricaNorthern EuropeNorwayOceaniaPakistanPanamaPeruPhilippinesPolandPortugalRomaniaRussiaSaudi ArabiaScotlandSenegalSerbiaSierra LeoneSingaporeSomaliaSouth AfricaSouth AmericaSouth Central AsiaSouth Eastern AsiaSouthern EuropeSpainSri LankaSt. Vincent and the GrenadinesSudanSwedenSwitzerlandSyriaTaiwanThailandTrinidad and TobagoTurkeyUgandaUkraineUruguayUzbekistanVenezuelaVietnamWest IndiesWestern AfricaWestern AsiaWestern EuropeYemenZaireZimbabweAzores
Unemployment Among Ages 20 to 24 years
Income
Poverty
Unemployment
Labor Participation
Family Structure
Vehicle Availability
Education Level
Disability

Unemployment Among Ages 20 to 24 years Comparison

Arapaho

Indians (Asian)

Tragic
Good
13.8%
UNEMPLOYMENT AMONG AGES 20 TO 24 YEARS
0.0/ 100
METRIC RATING
330th/ 347
METRIC RANK
10.3%
UNEMPLOYMENT AMONG AGES 20 TO 24 YEARS
62.6/ 100
METRIC RATING
161st/ 347
METRIC RANK

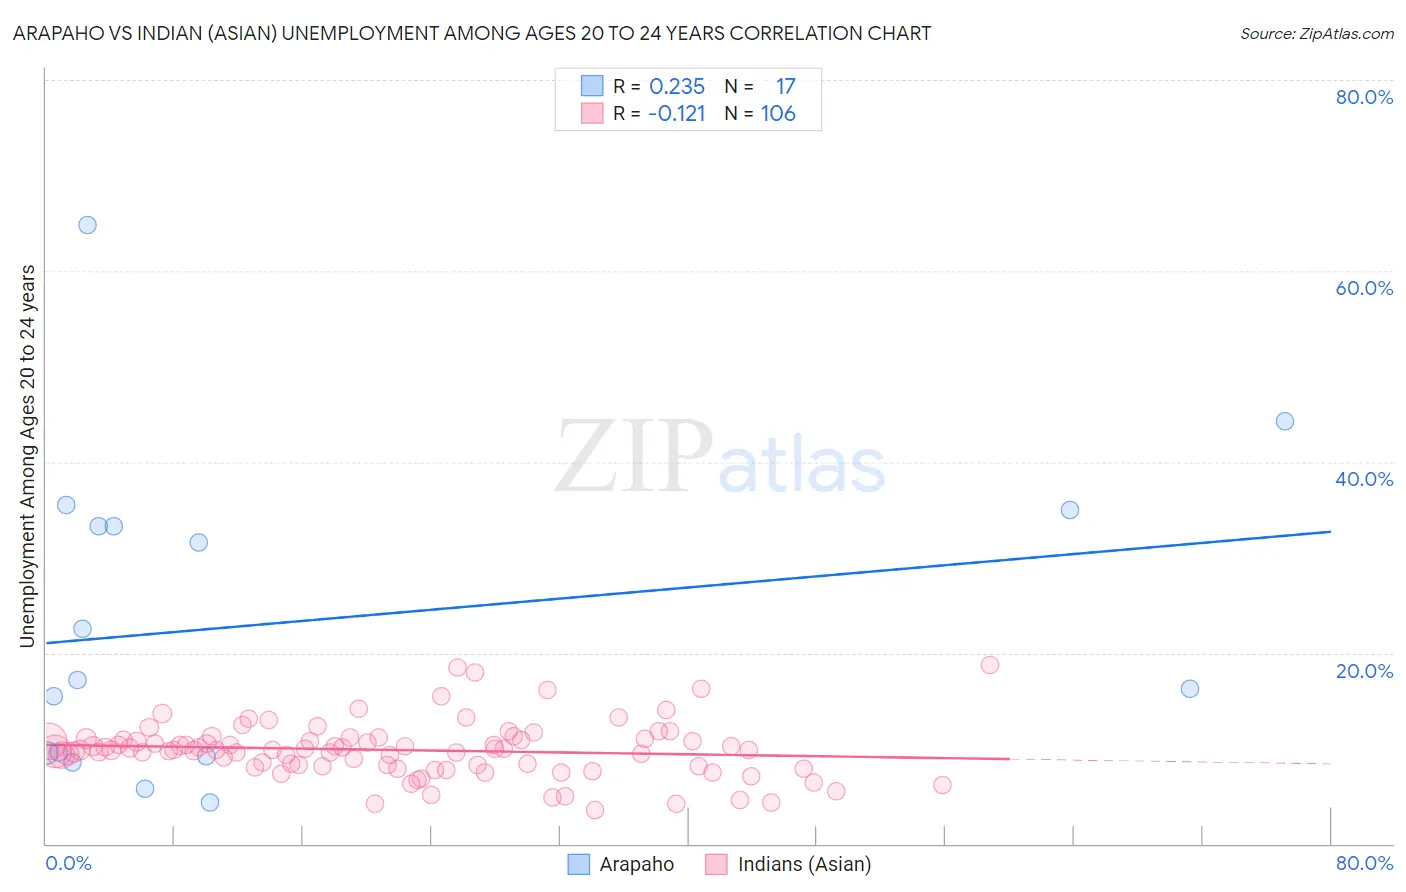
Arapaho vs Indian (Asian) Unemployment Among Ages 20 to 24 years Correlation Chart

The statistical analysis conducted on geographies consisting of 29,527,103 people shows a weak positive correlation between the proportion of Arapaho and unemployment rate among population between the ages 20 and 24 in the United States with a correlation coefficient (R) of 0.235 and weighted average of 13.8%. Similarly, the statistical analysis conducted on geographies consisting of 472,579,242 people shows a poor negative correlation between the proportion of Indians (Asian) and unemployment rate among population between the ages 20 and 24 in the United States with a correlation coefficient (R) of -0.121 and weighted average of 10.3%, a difference of 34.5%.
Arapaho vs Indian (Asian) Unemployment Among Ages 20 to 24 years

Unemployment Among Ages 20 to 24 years Correlation Summary

MeasurementArapahoIndian (Asian)
Minimum4.3%3.5%
Maximum64.8%18.7%
Range60.5%15.2%
Mean23.3%9.8%
Median17.2%9.8%
Interquartile 25% (IQ1)9.4%8.2%
Interquartile 75% (IQ3)34.1%10.9%
Interquartile Range (IQR)24.8%2.7%
Standard Deviation (Sample)16.5%2.9%
Standard Deviation (Population)16.0%2.9%

Similar Demographics by Unemployment Among Ages 20 to 24 years

Demographics Similar to Arapaho by Unemployment Among Ages 20 to 24 years

In terms of unemployment among ages 20 to 24 years, the demographic groups most similar to Arapaho are Dominican (13.8%, a difference of 0.080%), Aleut (13.8%, a difference of 0.27%), Immigrants from Grenada (13.8%, a difference of 0.34%), British West Indian (13.7%, a difference of 0.64%), and Immigrants from Guyana (13.9%, a difference of 0.85%).
DemographicsRating | RankUnemployment Among Ages 20 to 24 years
Yakama
0.0
/100
|
#323
Tragic
13.1%
Alaska Natives
0.0
/100
|
#324
Tragic
13.2%
Pueblo
0.0
/100
|
#325
Tragic
13.2%
Immigrants | Barbados
0.0
/100
|
#326
Tragic
13.5%
Immigrants | Dominican Republic
0.0
/100
|
#327
Tragic
13.6%
British West Indians
0.0
/100
|
#328
Tragic
13.7%
Dominicans
0.0
/100
|
#329
Tragic
13.8%
Arapaho
0.0
/100
|
#330
Tragic
13.8%
Aleuts
0.0
/100
|
#331
Tragic
13.8%
Immigrants | Grenada
0.0
/100
|
#332
Tragic
13.8%
Immigrants | Guyana
0.0
/100
|
#333
Tragic
13.9%
Guyanese
0.0
/100
|
#334
Tragic
14.0%
Sioux
0.0
/100
|
#335
Tragic
14.2%
Pima
0.0
/100
|
#336
Tragic
14.2%
Paiute
0.0
/100
|
#337
Tragic
14.3%

Demographics Similar to Indians (Asian) by Unemployment Among Ages 20 to 24 years

In terms of unemployment among ages 20 to 24 years, the demographic groups most similar to Indians (Asian) are Spaniard (10.3%, a difference of 0.030%), Immigrants from England (10.3%, a difference of 0.040%), Immigrants from Asia (10.3%, a difference of 0.050%), Estonian (10.3%, a difference of 0.060%), and Immigrants from Kazakhstan (10.2%, a difference of 0.11%).
DemographicsRating | RankUnemployment Among Ages 20 to 24 years
Immigrants | Switzerland
71.3
/100
|
#154
Good
10.2%
Lithuanians
70.0
/100
|
#155
Good
10.2%
Canadians
66.7
/100
|
#156
Good
10.2%
Immigrants | Uganda
65.6
/100
|
#157
Good
10.2%
Immigrants | Kazakhstan
65.5
/100
|
#158
Good
10.2%
Immigrants | England
63.7
/100
|
#159
Good
10.3%
Spaniards
63.4
/100
|
#160
Good
10.3%
Indians (Asian)
62.6
/100
|
#161
Good
10.3%
Immigrants | Asia
61.3
/100
|
#162
Good
10.3%
Estonians
61.1
/100
|
#163
Good
10.3%
Immigrants | Korea
59.0
/100
|
#164
Average
10.3%
Lebanese
58.3
/100
|
#165
Average
10.3%
Italians
57.7
/100
|
#166
Average
10.3%
Immigrants | Fiji
57.6
/100
|
#167
Average
10.3%
Iraqis
56.7
/100
|
#168
Average
10.3%