Albanian vs Dutch Unemployment Among Seniors over 65 years
COMPARE
Albanian
Dutch
Unemployment Among Seniors over 65 years
Unemployment Among Seniors over 65 years Comparison
Albanians
Dutch
5.2%
UNEMPLOYMENT AMONG SENIORS OVER 65 YEARS
9.1/ 100
METRIC RATING
214th/ 347
METRIC RANK
5.1%
UNEMPLOYMENT AMONG SENIORS OVER 65 YEARS
87.6/ 100
METRIC RATING
125th/ 347
METRIC RANK
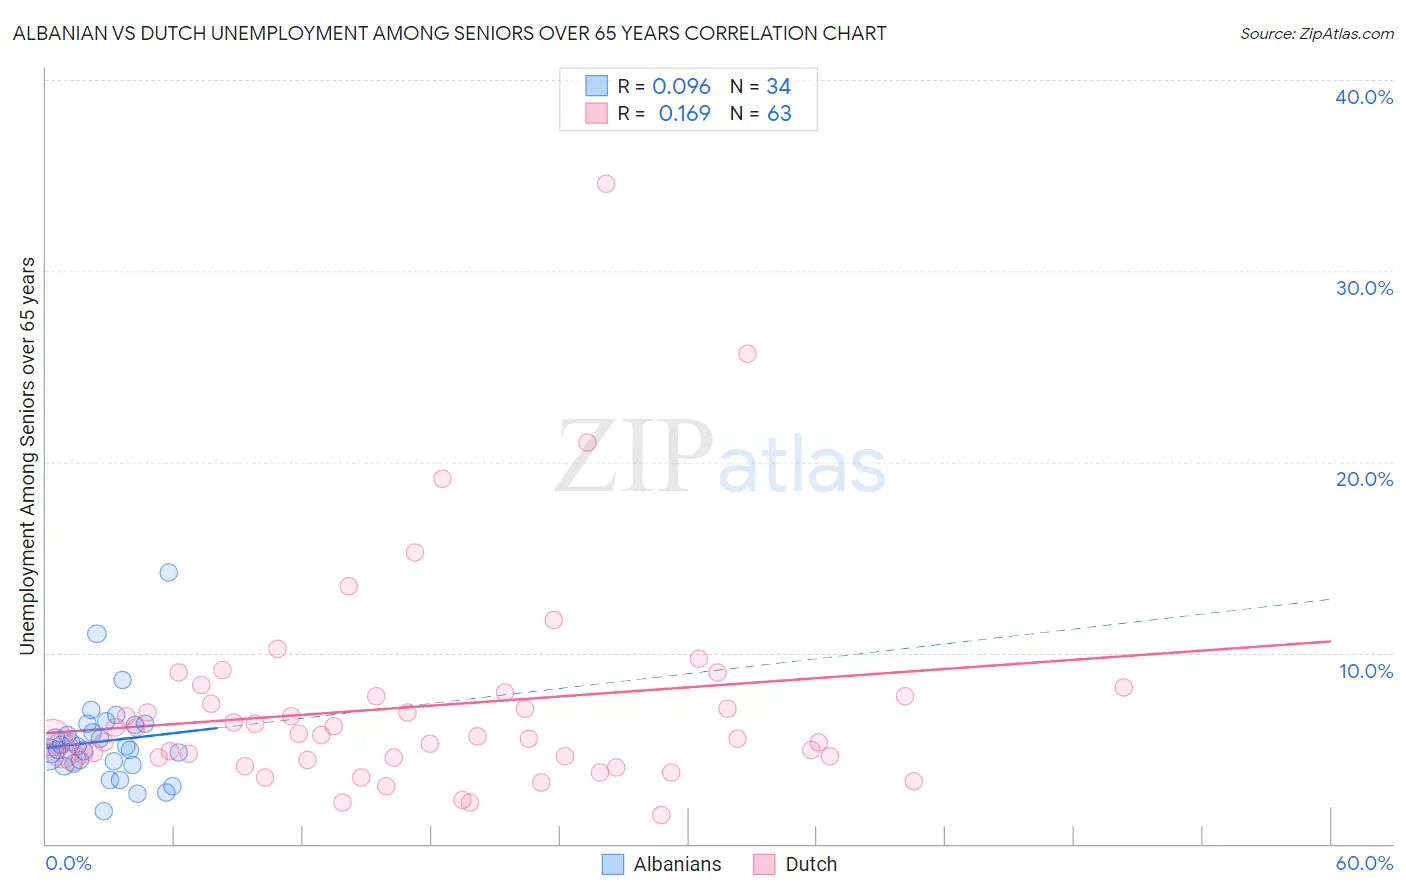
Albanian vs Dutch Unemployment Among Seniors over 65 years Correlation Chart
The statistical analysis conducted on geographies consisting of 181,763,809 people shows a slight positive correlation between the proportion of Albanians and unemployment rate amomg seniors over the age of 65 in the United States with a correlation coefficient (R) of 0.096 and weighted average of 5.2%. Similarly, the statistical analysis conducted on geographies consisting of 451,956,255 people shows a poor positive correlation between the proportion of Dutch and unemployment rate amomg seniors over the age of 65 in the United States with a correlation coefficient (R) of 0.169 and weighted average of 5.1%, a difference of 3.5%.
Unemployment Among Seniors over 65 years Correlation Summary
| Measurement | Albanian | Dutch |
| Minimum | 1.7% | 1.5% |
| Maximum | 14.2% | 34.6% |
| Range | 12.5% | 33.1% |
| Mean | 5.4% | 7.2% |
| Median | 5.0% | 5.6% |
| Interquartile 25% (IQ1) | 4.2% | 4.5% |
| Interquartile 75% (IQ3) | 6.2% | 7.7% |
| Interquartile Range (IQR) | 2.0% | 3.2% |
| Standard Deviation (Sample) | 2.3% | 5.6% |
| Standard Deviation (Population) | 2.3% | 5.5% |
Similar Demographics by Unemployment Among Seniors over 65 years
Demographics Similar to Albanians by Unemployment Among Seniors over 65 years
In terms of unemployment among seniors over 65 years, the demographic groups most similar to Albanians are Immigrants from Uruguay (5.2%, a difference of 0.030%), Immigrants from Fiji (5.2%, a difference of 0.050%), Cajun (5.2%, a difference of 0.050%), Italian (5.2%, a difference of 0.080%), and Immigrants from Honduras (5.2%, a difference of 0.10%).
| Demographics | Rating | Rank | Unemployment Among Seniors over 65 years |
| Immigrants | Philippines | 13.2 /100 | #207 | Poor 5.2% |
| Uruguayans | 12.6 /100 | #208 | Poor 5.2% |
| Alsatians | 11.4 /100 | #209 | Poor 5.2% |
| Immigrants | Uzbekistan | 10.7 /100 | #210 | Poor 5.2% |
| Africans | 10.4 /100 | #211 | Poor 5.2% |
| Immigrants | Honduras | 10.2 /100 | #212 | Poor 5.2% |
| Immigrants | Uruguay | 9.3 /100 | #213 | Tragic 5.2% |
| Albanians | 9.1 /100 | #214 | Tragic 5.2% |
| Immigrants | Fiji | 8.6 /100 | #215 | Tragic 5.2% |
| Cajuns | 8.5 /100 | #216 | Tragic 5.2% |
| Italians | 8.3 /100 | #217 | Tragic 5.2% |
| Spaniards | 7.4 /100 | #218 | Tragic 5.2% |
| Dutch West Indians | 6.9 /100 | #219 | Tragic 5.3% |
| Egyptians | 6.4 /100 | #220 | Tragic 5.3% |
| Arapaho | 6.3 /100 | #221 | Tragic 5.3% |
Demographics Similar to Dutch by Unemployment Among Seniors over 65 years
In terms of unemployment among seniors over 65 years, the demographic groups most similar to Dutch are Immigrants from North America (5.1%, a difference of 0.020%), Immigrants from Sri Lanka (5.1%, a difference of 0.020%), Sri Lankan (5.1%, a difference of 0.020%), Australian (5.1%, a difference of 0.040%), and Immigrants from Cameroon (5.1%, a difference of 0.070%).
| Demographics | Rating | Rank | Unemployment Among Seniors over 65 years |
| Soviet Union | 90.1 /100 | #118 | Exceptional 5.1% |
| Immigrants | Canada | 89.7 /100 | #119 | Excellent 5.1% |
| Irish | 88.8 /100 | #120 | Excellent 5.1% |
| Puget Sound Salish | 88.7 /100 | #121 | Excellent 5.1% |
| Immigrants | Cameroon | 88.6 /100 | #122 | Excellent 5.1% |
| Asians | 88.5 /100 | #123 | Excellent 5.1% |
| Immigrants | North America | 87.9 /100 | #124 | Excellent 5.1% |
| Dutch | 87.6 /100 | #125 | Excellent 5.1% |
| Immigrants | Sri Lanka | 87.4 /100 | #126 | Excellent 5.1% |
| Sri Lankans | 87.4 /100 | #127 | Excellent 5.1% |
| Australians | 87.1 /100 | #128 | Excellent 5.1% |
| Immigrants | England | 86.7 /100 | #129 | Excellent 5.1% |
| Iranians | 86.6 /100 | #130 | Excellent 5.1% |
| Immigrants | Australia | 85.8 /100 | #131 | Excellent 5.1% |
| Chileans | 85.6 /100 | #132 | Excellent 5.1% |