Albanian vs Arapaho Unemployment Among Seniors over 65 years
COMPARE
Albanian
Arapaho
Unemployment Among Seniors over 65 years
Unemployment Among Seniors over 65 years Comparison
Albanians
Arapaho
5.2%
UNEMPLOYMENT AMONG SENIORS OVER 65 YEARS
9.1/ 100
METRIC RATING
214th/ 347
METRIC RANK
5.3%
UNEMPLOYMENT AMONG SENIORS OVER 65 YEARS
6.3/ 100
METRIC RATING
221st/ 347
METRIC RANK
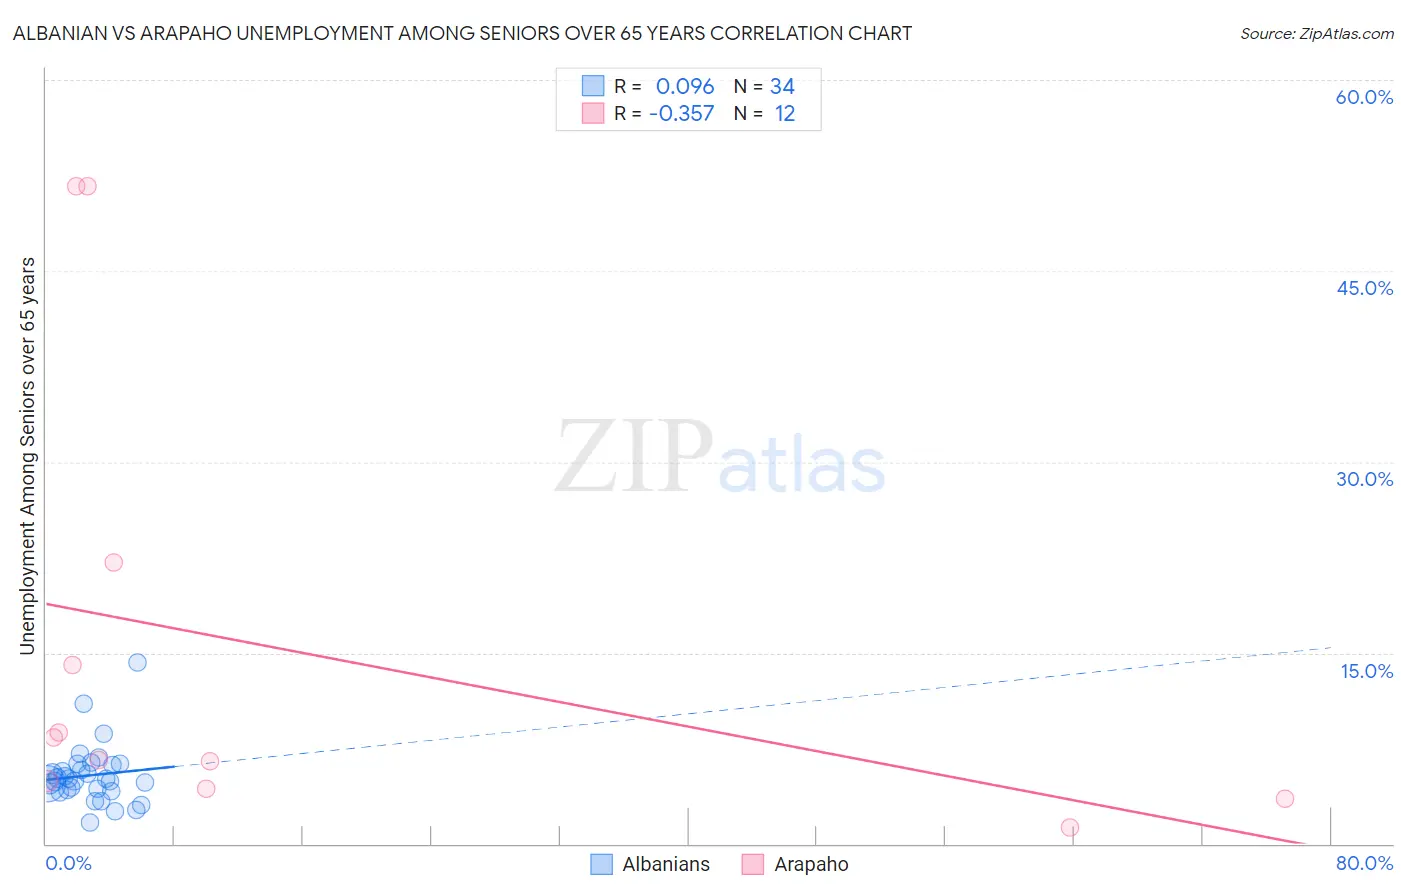
Albanian vs Arapaho Unemployment Among Seniors over 65 years Correlation Chart
The statistical analysis conducted on geographies consisting of 181,763,809 people shows a slight positive correlation between the proportion of Albanians and unemployment rate amomg seniors over the age of 65 in the United States with a correlation coefficient (R) of 0.096 and weighted average of 5.2%. Similarly, the statistical analysis conducted on geographies consisting of 28,272,989 people shows a mild negative correlation between the proportion of Arapaho and unemployment rate amomg seniors over the age of 65 in the United States with a correlation coefficient (R) of -0.357 and weighted average of 5.3%, a difference of 0.31%.
Unemployment Among Seniors over 65 years Correlation Summary
| Measurement | Albanian | Arapaho |
| Minimum | 1.7% | 1.3% |
| Maximum | 14.2% | 51.7% |
| Range | 12.5% | 50.4% |
| Mean | 5.4% | 15.3% |
| Median | 5.0% | 7.5% |
| Interquartile 25% (IQ1) | 4.2% | 4.6% |
| Interquartile 75% (IQ3) | 6.2% | 18.0% |
| Interquartile Range (IQR) | 2.0% | 13.4% |
| Standard Deviation (Sample) | 2.3% | 17.9% |
| Standard Deviation (Population) | 2.3% | 17.1% |
Demographics Similar to Albanians and Arapaho by Unemployment Among Seniors over 65 years
In terms of unemployment among seniors over 65 years, the demographic groups most similar to Albanians are Immigrants from Uruguay (5.2%, a difference of 0.030%), Immigrants from Fiji (5.2%, a difference of 0.050%), Cajun (5.2%, a difference of 0.050%), Italian (5.2%, a difference of 0.080%), and Immigrants from Honduras (5.2%, a difference of 0.10%). Similarly, the demographic groups most similar to Arapaho are Egyptian (5.3%, a difference of 0.010%), Israeli (5.3%, a difference of 0.020%), Dutch West Indian (5.3%, a difference of 0.070%), Cree (5.3%, a difference of 0.080%), and Immigrants from Syria (5.3%, a difference of 0.10%).
| Demographics | Rating | Rank | Unemployment Among Seniors over 65 years |
| Immigrants | Philippines | 13.2 /100 | #207 | Poor 5.2% |
| Uruguayans | 12.6 /100 | #208 | Poor 5.2% |
| Alsatians | 11.4 /100 | #209 | Poor 5.2% |
| Immigrants | Uzbekistan | 10.7 /100 | #210 | Poor 5.2% |
| Africans | 10.4 /100 | #211 | Poor 5.2% |
| Immigrants | Honduras | 10.2 /100 | #212 | Poor 5.2% |
| Immigrants | Uruguay | 9.3 /100 | #213 | Tragic 5.2% |
| Albanians | 9.1 /100 | #214 | Tragic 5.2% |
| Immigrants | Fiji | 8.6 /100 | #215 | Tragic 5.2% |
| Cajuns | 8.5 /100 | #216 | Tragic 5.2% |
| Italians | 8.3 /100 | #217 | Tragic 5.2% |
| Spaniards | 7.4 /100 | #218 | Tragic 5.2% |
| Dutch West Indians | 6.9 /100 | #219 | Tragic 5.3% |
| Egyptians | 6.4 /100 | #220 | Tragic 5.3% |
| Arapaho | 6.3 /100 | #221 | Tragic 5.3% |
| Israelis | 6.2 /100 | #222 | Tragic 5.3% |
| Cree | 5.8 /100 | #223 | Tragic 5.3% |
| Immigrants | Syria | 5.6 /100 | #224 | Tragic 5.3% |
| Hondurans | 5.6 /100 | #225 | Tragic 5.3% |
| Immigrants | Croatia | 5.3 /100 | #226 | Tragic 5.3% |
| French American Indians | 5.2 /100 | #227 | Tragic 5.3% |