Zip Codes with the Highest Percentage of Households Without a Vehicle in Guaynabo, PR
RELATED REPORTS & OPTIONS
Households without a Cars
Guaynabo
Compare Zip Codes
Map of Zip Codes with the Highest Percentage of Households Without a Vehicle in Guaynabo
8.1%
22.3%
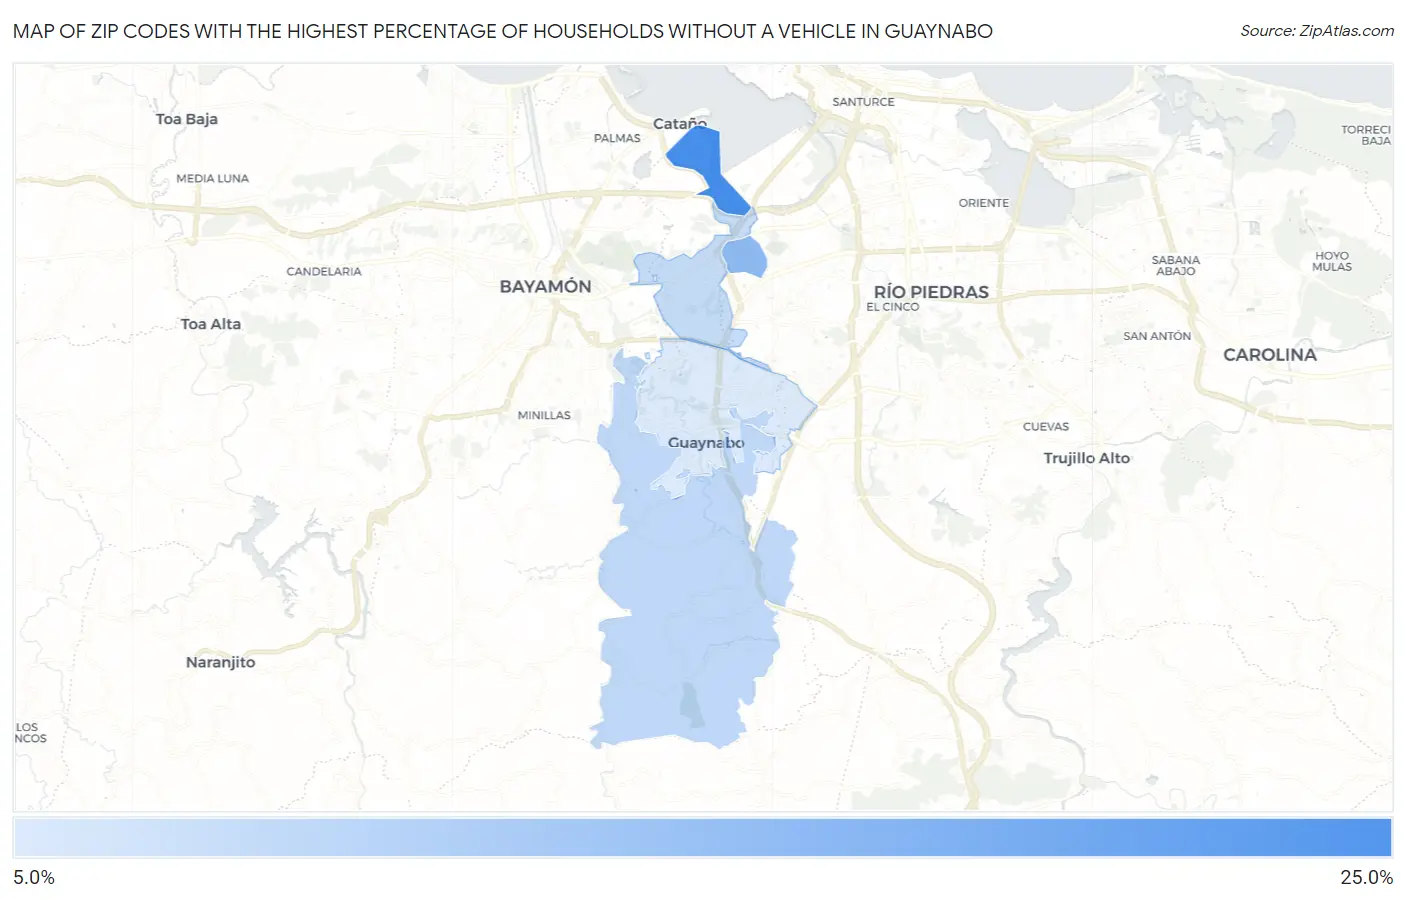
Zip Codes with the Highest Percentage of Households Without a Vehicle in Guaynabo, PR
| Zip Code | Housholds Without a Car | vs State | vs National | |
| 1. | 00965 | 22.3% | 14.0%(+8.30)#17 | 8.3%(+14.0)#1,277 |
| 2. | 00968 | 15.3% | 14.0%(+1.30)#40 | 8.3%(+7.00)#2,306 |
| 3. | 00971 | 10.7% | 14.0%(-3.30)#98 | 8.3%(+2.40)#4,312 |
| 4. | 00966 | 10.1% | 14.0%(-3.90)#110 | 8.3%(+1.80)#4,789 |
| 5. | 00969 | 8.1% | 14.0%(-5.90)#122 | 8.3%(-0.200)#6,784 |
1
Common Questions
What are the Top 3 Zip Codes with the Highest Percentage of Households Without a Vehicle in Guaynabo, PR?
Top 3 Zip Codes with the Highest Percentage of Households Without a Vehicle in Guaynabo, PR are:
What zip code has the Highest Percentage of Households Without a Vehicle in Guaynabo, PR?
00965 has the Highest Percentage of Households Without a Vehicle in Guaynabo, PR with 22.3%.
What is the Percentage of Households Without a Vehicle in Guaynabo, PR?
Percentage of Households Without a Vehicle in Guaynabo is 9.4%.
What is the Percentage of Households Without a Vehicle in Puerto Rico?
Percentage of Households Without a Vehicle in Puerto Rico is 14.0%.
What is the Percentage of Households Without a Vehicle in the United States?
Percentage of Households Without a Vehicle in the United States is 8.3%.