Zip Codes with the Highest Percentage of Households with Income Below $10,000 in Bayamon, PR
RELATED REPORTS & OPTIONS
Household Income | $0-10k
Bayamon
Compare Zip Codes
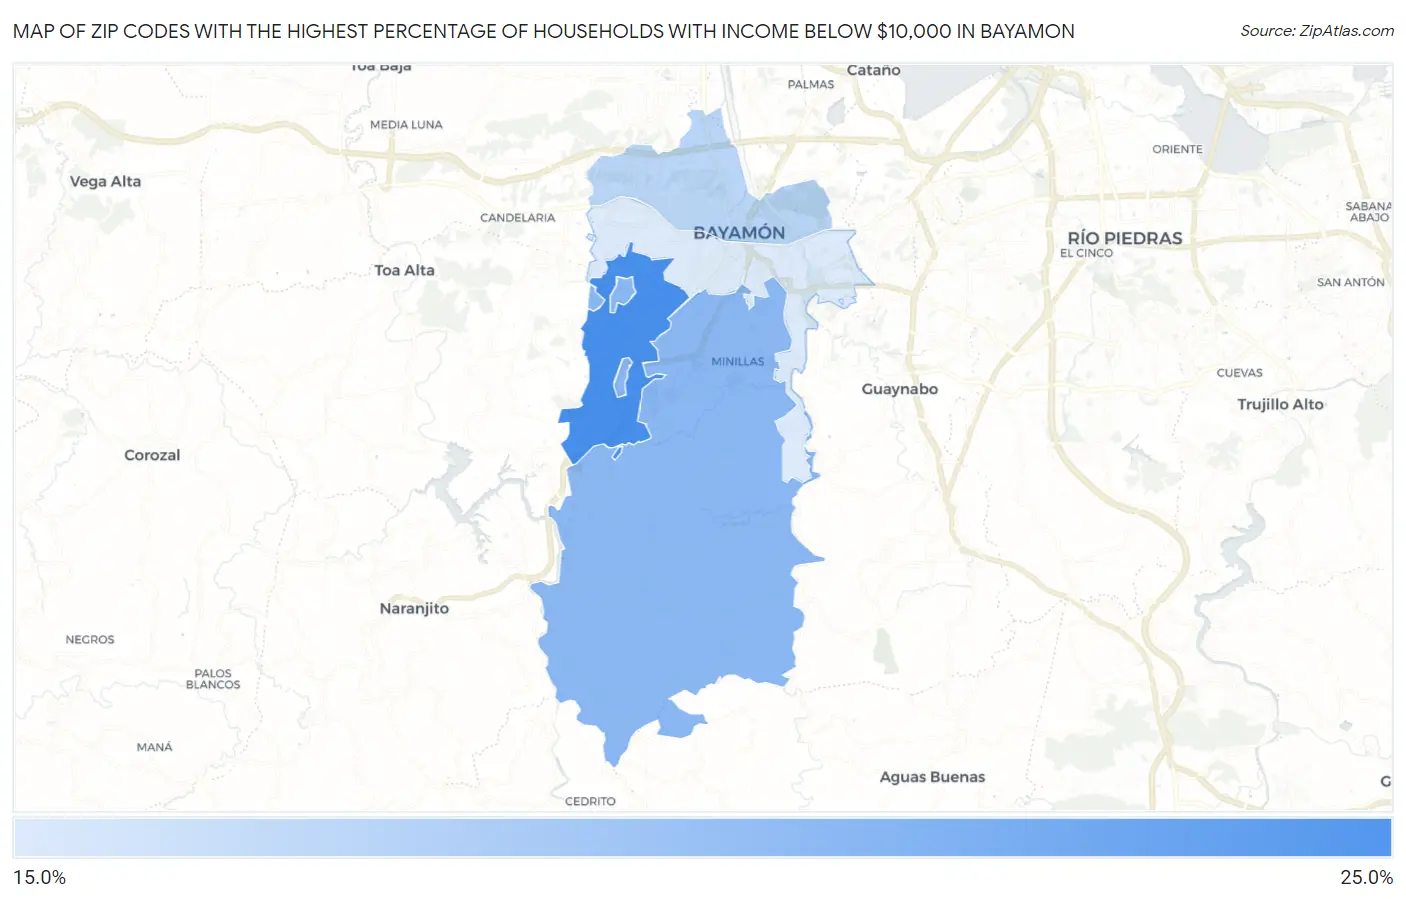
Map of Zip Codes with the Highest Percentage of Households with Income Below $10,000 in Bayamon
17.7%
20.4%
Zip Codes with the Highest Percentage of Households with Income Below $10,000 in Bayamon, PR
| Zip Code | Households with Income < $10k | vs State | vs National | |
| 1. | 00957 | 20.4% | 22.7%(-2.30)#87 | 4.9%(+15.5)#757 |
| 2. | 00956 | 19.2% | 22.7%(-3.50)#94 | 4.9%(+14.3)#875 |
| 3. | 00961 | 18.3% | 22.7%(-4.40)#99 | 4.9%(+13.4)#972 |
| 4. | 00959 | 17.7% | 22.7%(-5.00)#103 | 4.9%(+12.8)#1,053 |
1
Common Questions
What are the Top 3 Zip Codes with the Highest Percentage of Households with Income Below $10,000 in Bayamon, PR?
Top 3 Zip Codes with the Highest Percentage of Households with Income Below $10,000 in Bayamon, PR are:
What zip code has the Highest Percentage of Households with Income Below $10,000 in Bayamon, PR?
00957 has the Highest Percentage of Households with Income Below $10,000 in Bayamon, PR with 20.4%.
What is the Percentage of Households with Income Below $10,000 in Bayamon, PR?
Percentage of Households with Income Below $10,000 in Bayamon is 21.3%.
What is the Percentage of Households with Income Below $10,000 in Puerto Rico?
Percentage of Households with Income Below $10,000 in Puerto Rico is 22.7%.
What is the Percentage of Households with Income Below $10,000 in the United States?
Percentage of Households with Income Below $10,000 in the United States is 4.9%.