Zip Codes with the Highest Percentage of Population Employed in Manufacturing in Bayamon, PR
RELATED REPORTS & OPTIONS
Manufacturing
Bayamon
Compare Zip Codes
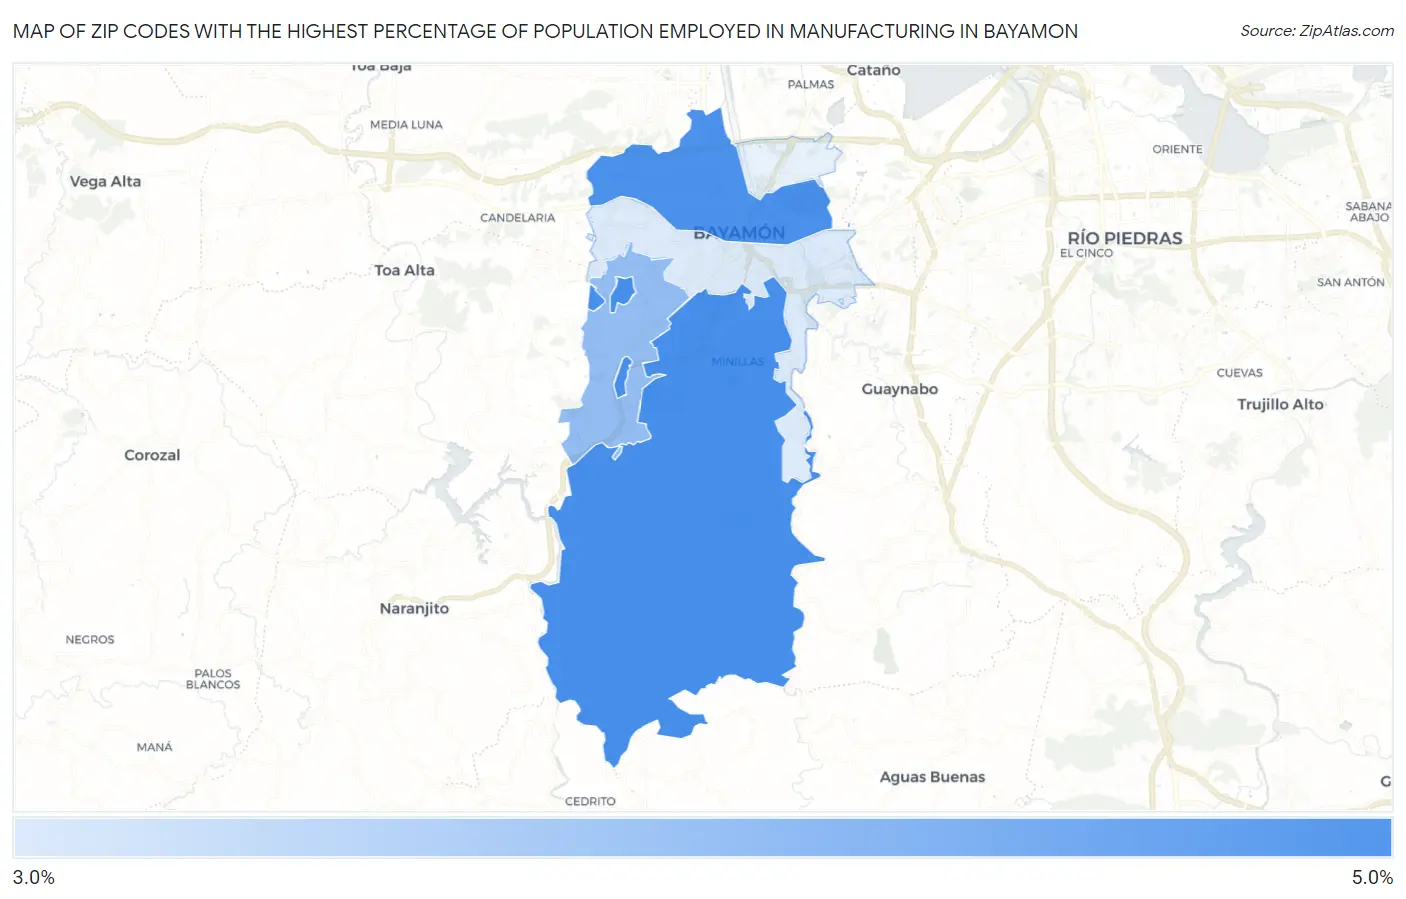
Map of Zip Codes with the Highest Percentage of Population Employed in Manufacturing in Bayamon
3.2%
5.0%
Zip Codes with the Highest Percentage of Population Employed in Manufacturing in Bayamon, PR
| Zip Code | % Employed | vs State | vs National | |
| 1. | 00956 | 5.0% | 9.0%(-4.02)#95 | 10.0%(-5.02)#24,469 |
| 2. | 00961 | 4.9% | 9.0%(-4.06)#97 | 10.0%(-5.07)#24,560 |
| 3. | 00957 | 4.1% | 9.0%(-4.90)#105 | 10.0%(-5.90)#25,939 |
| 4. | 00959 | 3.2% | 9.0%(-5.74)#112 | 10.0%(-6.74)#27,099 |
1
Common Questions
What are the Top 3 Zip Codes with the Highest Percentage of Population Employed in Manufacturing in Bayamon, PR?
Top 3 Zip Codes with the Highest Percentage of Population Employed in Manufacturing in Bayamon, PR are:
What zip code has the Highest Percentage of Population Employed in Manufacturing in Bayamon, PR?
00956 has the Highest Percentage of Population Employed in Manufacturing in Bayamon, PR with 5.0%.
What is the Percentage of Population Employed in Manufacturing in Puerto Rico?
Percentage of Population Employed in Manufacturing in Puerto Rico is 9.0%.
What is the Percentage of Population Employed in Manufacturing in the United States?
Percentage of Population Employed in Manufacturing in the United States is 10.0%.