Zip Codes with the Highest Percentage of Local Government Employees in Bayamon, PR
RELATED REPORTS & OPTIONS
Local Government Employees
Bayamon
Compare Zip Codes
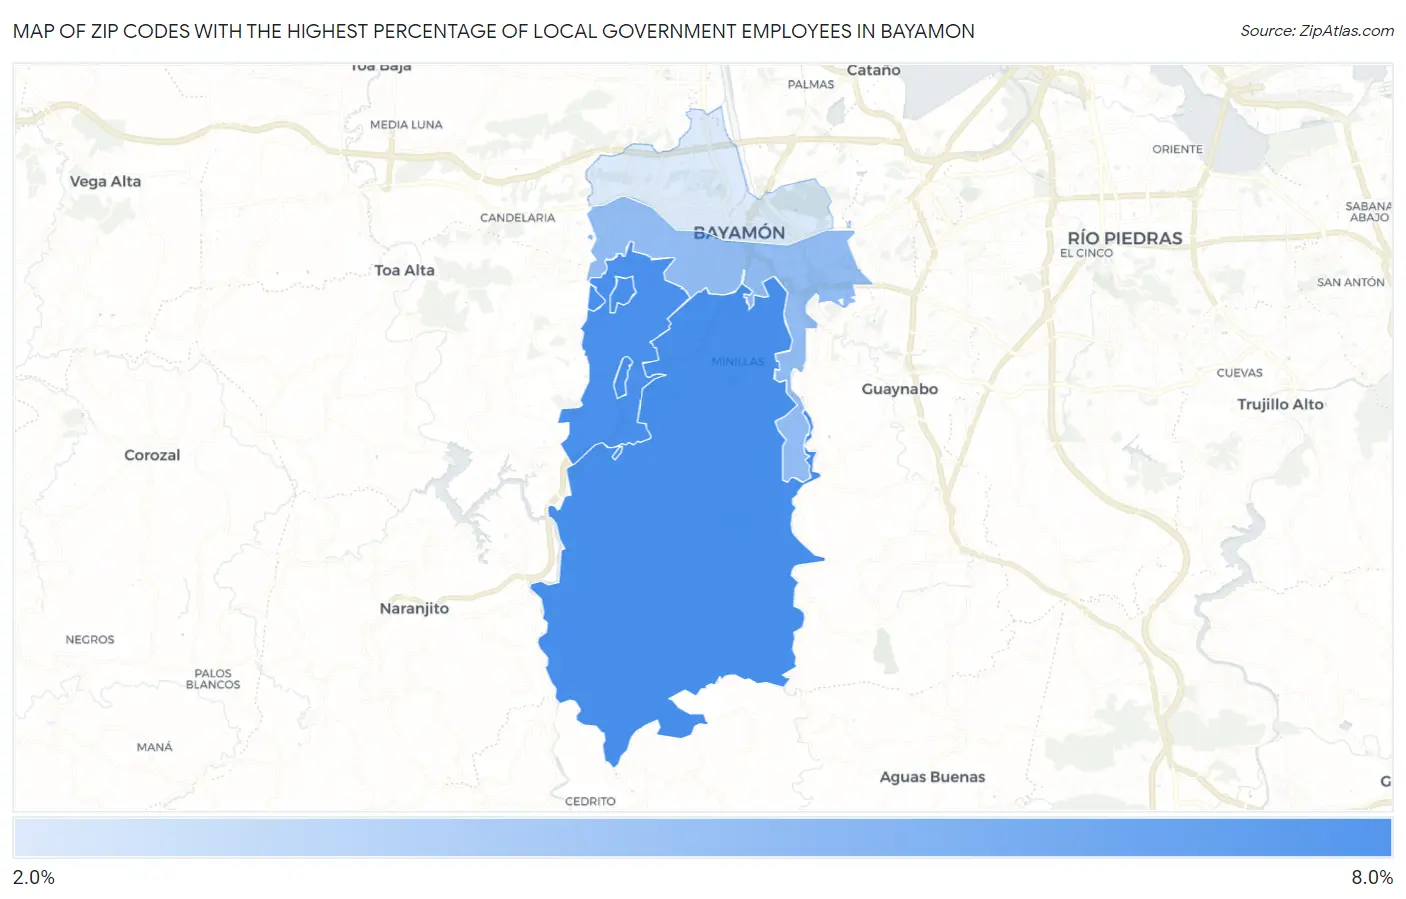
Map of Zip Codes with the Highest Percentage of Local Government Employees in Bayamon
2.3%
6.8%
Zip Codes with the Highest Percentage of Local Government Employees in Bayamon, PR
| Zip Code | % Local Government Employees | vs State | vs National | |
| 1. | 00956 | 6.8% | 5.6%(+1.25)#44 | 7.2%(-0.416)#17,028 |
| 2. | 00957 | 6.7% | 5.6%(+1.18)#45 | 7.2%(-0.484)#17,246 |
| 3. | 00959 | 4.6% | 5.6%(-0.990)#86 | 7.2%(-2.65)#24,226 |
| 4. | 00961 | 2.3% | 5.6%(-3.24)#120 | 7.2%(-4.91)#28,411 |
1
Common Questions
What are the Top 3 Zip Codes with the Highest Percentage of Local Government Employees in Bayamon, PR?
Top 3 Zip Codes with the Highest Percentage of Local Government Employees in Bayamon, PR are:
What zip code has the Highest Percentage of Local Government Employees in Bayamon, PR?
00956 has the Highest Percentage of Local Government Employees in Bayamon, PR with 6.8%.
What is the Percentage of Local Government Employees in Bayamon, PR?
Percentage of Local Government Employees in Bayamon is 4.0%.
What is the Percentage of Local Government Employees in Puerto Rico?
Percentage of Local Government Employees in Puerto Rico is 5.6%.
What is the Percentage of Local Government Employees in the United States?
Percentage of Local Government Employees in the United States is 7.2%.