Zip Codes with the Highest Percentage of Population Employed in Office & Administration in Bayamon, PR
RELATED REPORTS & OPTIONS
Office & Administration
Bayamon
Compare Zip Codes
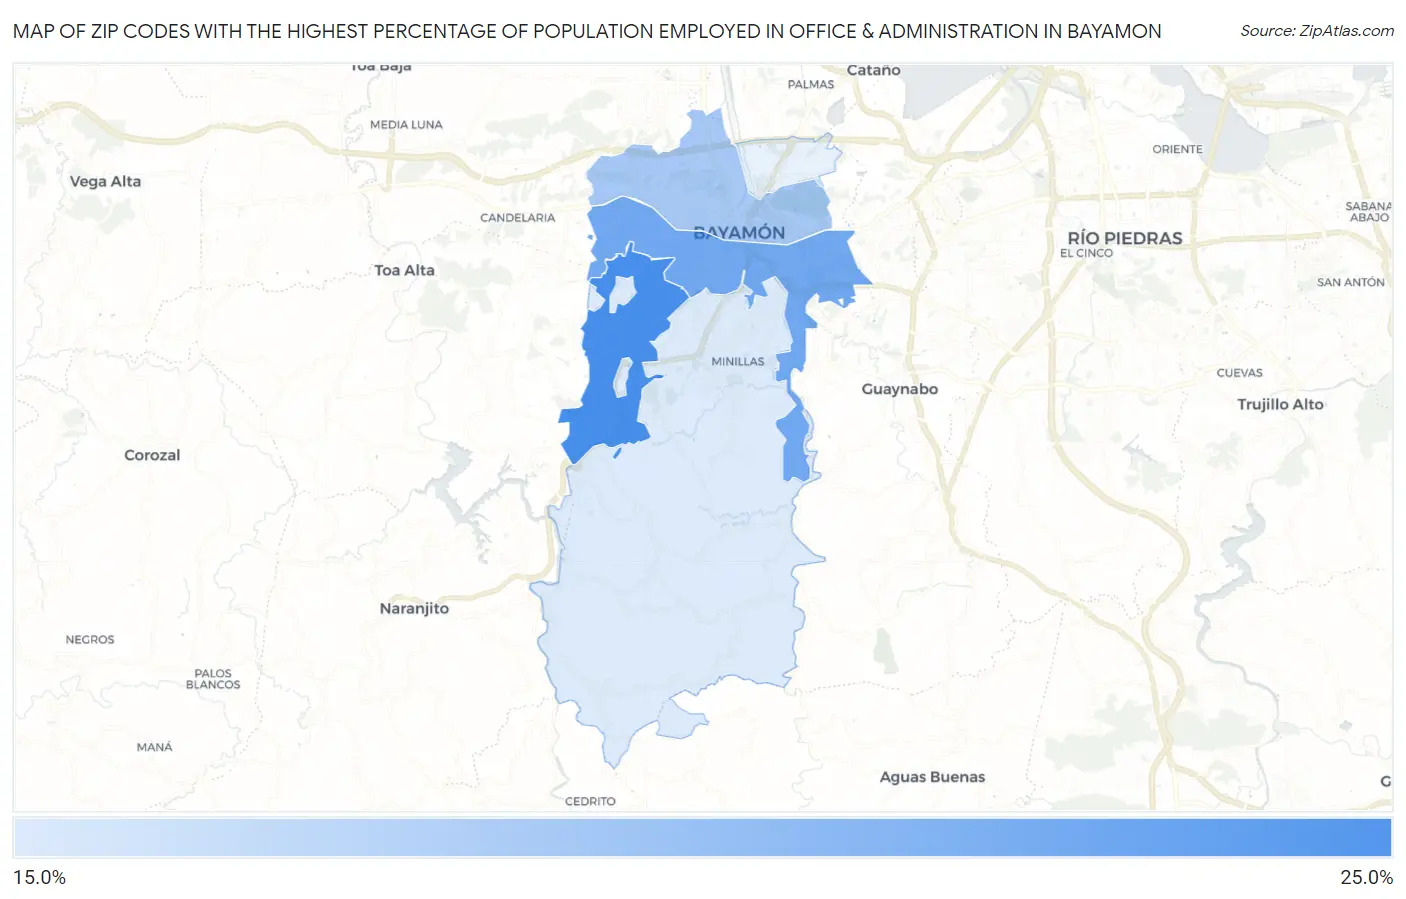
Map of Zip Codes with the Highest Percentage of Population Employed in Office & Administration in Bayamon
15.0%
20.0%
Zip Codes with the Highest Percentage of Population Employed in Office & Administration in Bayamon, PR
| Zip Code | % Employed | vs State | vs National | |
| 1. | 00957 | 20.0% | 13.9%(+6.15)#5 | 10.9%(+9.18)#1,677 |
| 2. | 00959 | 18.7% | 13.9%(+4.78)#12 | 10.9%(+7.82)#2,090 |
| 3. | 00961 | 16.9% | 13.9%(+2.98)#22 | 10.9%(+6.01)#2,920 |
| 4. | 00956 | 15.0% | 13.9%(+1.16)#35 | 10.9%(+4.19)#4,499 |
1
Common Questions
What are the Top 3 Zip Codes with the Highest Percentage of Population Employed in Office & Administration in Bayamon, PR?
Top 3 Zip Codes with the Highest Percentage of Population Employed in Office & Administration in Bayamon, PR are:
What zip code has the Highest Percentage of Population Employed in Office & Administration in Bayamon, PR?
00957 has the Highest Percentage of Population Employed in Office & Administration in Bayamon, PR with 20.0%.
What is the Percentage of Population Employed in Office & Administration in Puerto Rico?
Percentage of Population Employed in Office & Administration in Puerto Rico is 13.9%.
What is the Percentage of Population Employed in Office & Administration in the United States?
Percentage of Population Employed in Office & Administration in the United States is 10.9%.