Zimbabwean vs Belizean Seniors Poverty Over the Age of 65
COMPARE
Zimbabwean
Belizean
Seniors Poverty Over the Age of 65
Seniors Poverty Over the Age of 65 Comparison
Zimbabweans
Belizeans
9.6%
SENIORS POVERTY OVER THE AGE OF 65
99.6/ 100
METRIC RATING
42nd/ 347
METRIC RANK
13.6%
SENIORS POVERTY OVER THE AGE OF 65
0.0/ 100
METRIC RATING
288th/ 347
METRIC RANK
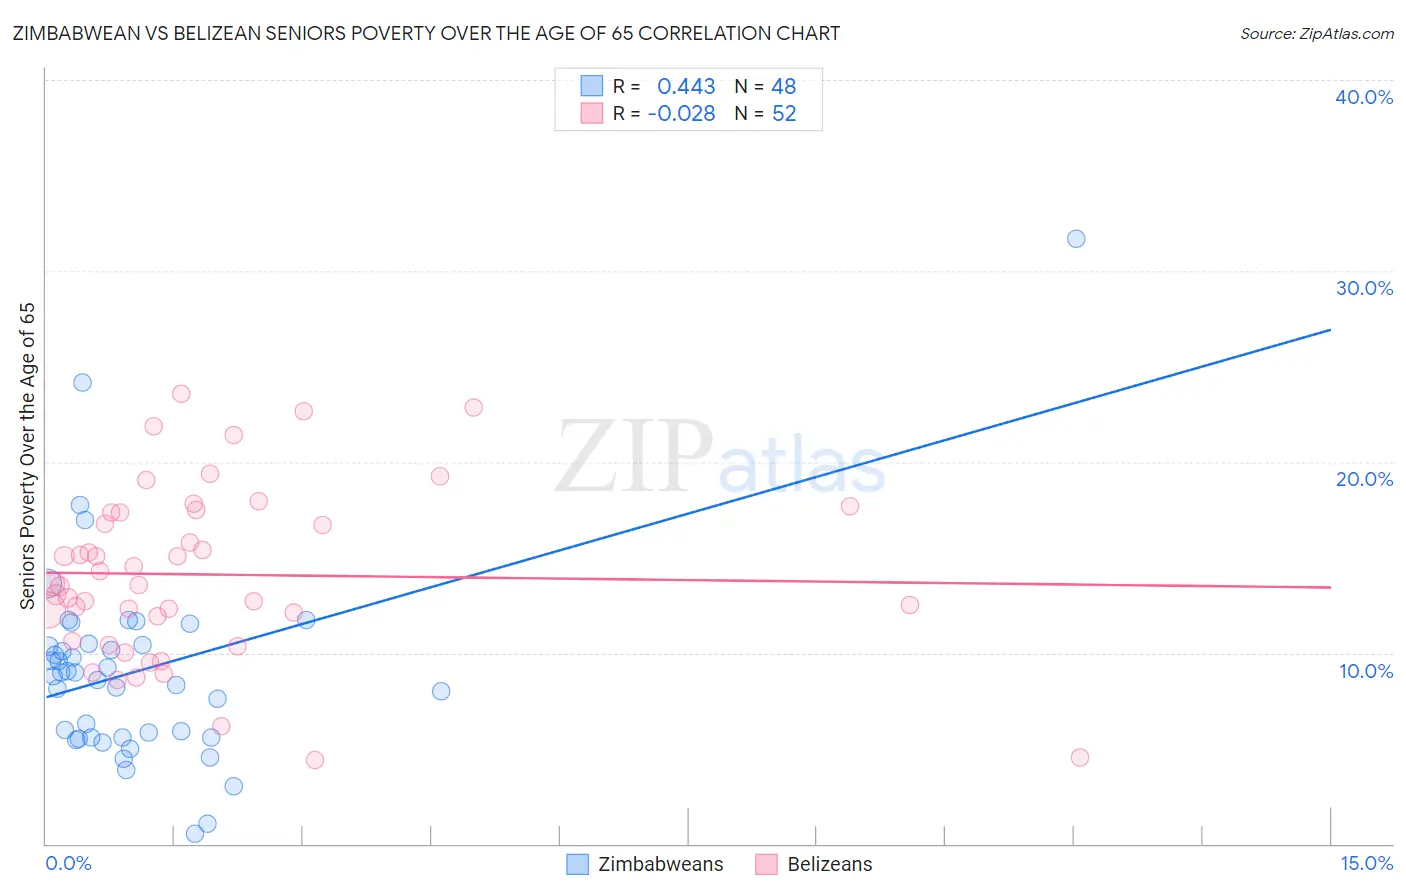
Zimbabwean vs Belizean Seniors Poverty Over the Age of 65 Correlation Chart
The statistical analysis conducted on geographies consisting of 69,092,628 people shows a moderate positive correlation between the proportion of Zimbabweans and poverty level among seniors over the age of 65 in the United States with a correlation coefficient (R) of 0.443 and weighted average of 9.6%. Similarly, the statistical analysis conducted on geographies consisting of 144,100,928 people shows no correlation between the proportion of Belizeans and poverty level among seniors over the age of 65 in the United States with a correlation coefficient (R) of -0.028 and weighted average of 13.6%, a difference of 41.6%.
Seniors Poverty Over the Age of 65 Correlation Summary
| Measurement | Zimbabwean | Belizean |
| Minimum | 0.55% | 4.4% |
| Maximum | 31.7% | 23.6% |
| Range | 31.2% | 19.2% |
| Mean | 9.1% | 14.1% |
| Median | 8.9% | 13.6% |
| Interquartile 25% (IQ1) | 5.6% | 11.3% |
| Interquartile 75% (IQ3) | 10.5% | 17.4% |
| Interquartile Range (IQR) | 4.9% | 6.1% |
| Standard Deviation (Sample) | 5.3% | 4.5% |
| Standard Deviation (Population) | 5.3% | 4.4% |
Similar Demographics by Seniors Poverty Over the Age of 65
Demographics Similar to Zimbabweans by Seniors Poverty Over the Age of 65
In terms of seniors poverty over the age of 65, the demographic groups most similar to Zimbabweans are Eastern European (9.6%, a difference of 0.10%), Immigrants from North Macedonia (9.6%, a difference of 0.15%), Austrian (9.6%, a difference of 0.20%), Assyrian/Chaldean/Syriac (9.6%, a difference of 0.32%), and Estonian (9.6%, a difference of 0.38%).
| Demographics | Rating | Rank | Seniors Poverty Over the Age of 65 |
| Latvians | 99.8 /100 | #35 | Exceptional 9.5% |
| Czechoslovakians | 99.8 /100 | #36 | Exceptional 9.5% |
| Scotch-Irish | 99.7 /100 | #37 | Exceptional 9.5% |
| Belgians | 99.7 /100 | #38 | Exceptional 9.5% |
| Greeks | 99.6 /100 | #39 | Exceptional 9.6% |
| Assyrians/Chaldeans/Syriacs | 99.6 /100 | #40 | Exceptional 9.6% |
| Immigrants | North Macedonia | 99.6 /100 | #41 | Exceptional 9.6% |
| Zimbabweans | 99.6 /100 | #42 | Exceptional 9.6% |
| Eastern Europeans | 99.6 /100 | #43 | Exceptional 9.6% |
| Austrians | 99.5 /100 | #44 | Exceptional 9.6% |
| Estonians | 99.5 /100 | #45 | Exceptional 9.6% |
| Immigrants | Taiwan | 99.5 /100 | #46 | Exceptional 9.7% |
| Immigrants | South Central Asia | 99.5 /100 | #47 | Exceptional 9.7% |
| French | 99.5 /100 | #48 | Exceptional 9.7% |
| Immigrants | Lithuania | 99.4 /100 | #49 | Exceptional 9.7% |
Demographics Similar to Belizeans by Seniors Poverty Over the Age of 65
In terms of seniors poverty over the age of 65, the demographic groups most similar to Belizeans are Immigrants from Mexico (13.6%, a difference of 0.14%), Immigrants from Senegal (13.6%, a difference of 0.26%), Jamaican (13.6%, a difference of 0.27%), Immigrants from Central America (13.6%, a difference of 0.27%), and Guatemalan (13.5%, a difference of 0.54%).
| Demographics | Rating | Rank | Seniors Poverty Over the Age of 65 |
| Immigrants | El Salvador | 0.0 /100 | #281 | Tragic 13.1% |
| Senegalese | 0.0 /100 | #282 | Tragic 13.3% |
| Central Americans | 0.0 /100 | #283 | Tragic 13.4% |
| Colville | 0.0 /100 | #284 | Tragic 13.5% |
| Guatemalans | 0.0 /100 | #285 | Tragic 13.5% |
| Immigrants | Senegal | 0.0 /100 | #286 | Tragic 13.6% |
| Immigrants | Mexico | 0.0 /100 | #287 | Tragic 13.6% |
| Belizeans | 0.0 /100 | #288 | Tragic 13.6% |
| Jamaicans | 0.0 /100 | #289 | Tragic 13.6% |
| Immigrants | Central America | 0.0 /100 | #290 | Tragic 13.6% |
| Blacks/African Americans | 0.0 /100 | #291 | Tragic 13.7% |
| Spanish American Indians | 0.0 /100 | #292 | Tragic 13.8% |
| Immigrants | Guatemala | 0.0 /100 | #293 | Tragic 13.8% |
| Cheyenne | 0.0 /100 | #294 | Tragic 13.9% |
| Apache | 0.0 /100 | #295 | Tragic 13.9% |