Yaqui vs Immigrants from Serbia Seniors Poverty Over the Age of 65
COMPARE
Yaqui
Immigrants from Serbia
Seniors Poverty Over the Age of 65
Seniors Poverty Over the Age of 65 Comparison
Yaqui
Immigrants from Serbia
11.9%
SENIORS POVERTY OVER THE AGE OF 65
1.9/ 100
METRIC RATING
232nd/ 347
METRIC RANK
10.5%
SENIORS POVERTY OVER THE AGE OF 65
86.4/ 100
METRIC RATING
136th/ 347
METRIC RANK
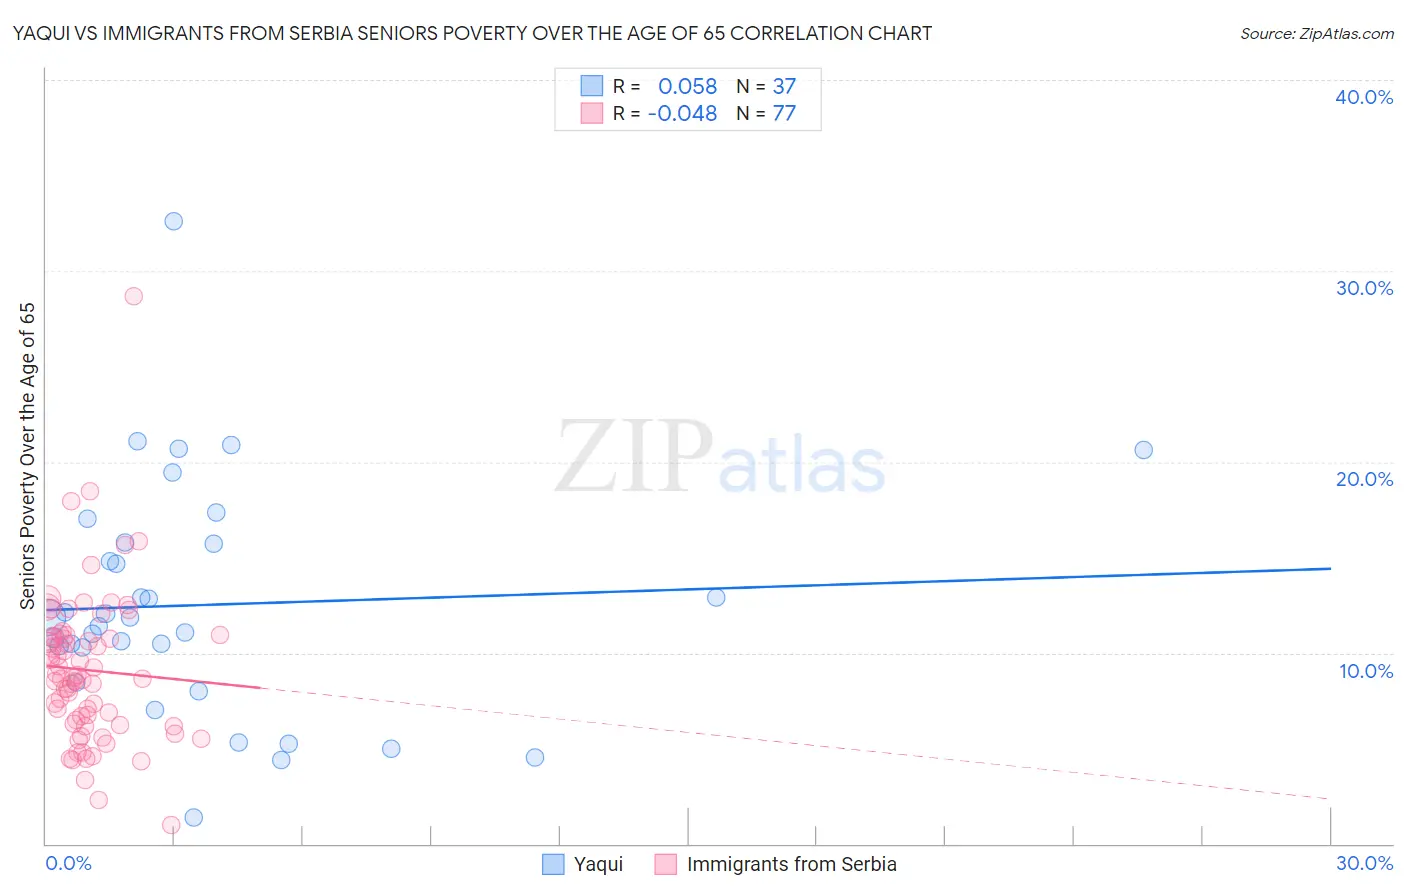
Yaqui vs Immigrants from Serbia Seniors Poverty Over the Age of 65 Correlation Chart
The statistical analysis conducted on geographies consisting of 107,577,595 people shows a slight positive correlation between the proportion of Yaqui and poverty level among seniors over the age of 65 in the United States with a correlation coefficient (R) of 0.058 and weighted average of 11.9%. Similarly, the statistical analysis conducted on geographies consisting of 131,575,846 people shows no correlation between the proportion of Immigrants from Serbia and poverty level among seniors over the age of 65 in the United States with a correlation coefficient (R) of -0.048 and weighted average of 10.5%, a difference of 13.5%.
Seniors Poverty Over the Age of 65 Correlation Summary
| Measurement | Yaqui | Immigrants from Serbia |
| Minimum | 1.4% | 1.0% |
| Maximum | 32.6% | 28.7% |
| Range | 31.2% | 27.7% |
| Mean | 12.5% | 9.1% |
| Median | 11.9% | 8.7% |
| Interquartile 25% (IQ1) | 9.4% | 6.3% |
| Interquartile 75% (IQ3) | 15.7% | 10.9% |
| Interquartile Range (IQR) | 6.4% | 4.7% |
| Standard Deviation (Sample) | 6.0% | 4.1% |
| Standard Deviation (Population) | 6.0% | 4.0% |
Similar Demographics by Seniors Poverty Over the Age of 65
Demographics Similar to Yaqui by Seniors Poverty Over the Age of 65
In terms of seniors poverty over the age of 65, the demographic groups most similar to Yaqui are Panamanian (11.9%, a difference of 0.10%), Cajun (11.9%, a difference of 0.14%), Bermudan (11.9%, a difference of 0.19%), Iroquois (11.9%, a difference of 0.19%), and Immigrants from Eritrea (11.8%, a difference of 0.69%).
| Demographics | Rating | Rank | Seniors Poverty Over the Age of 65 |
| Immigrants | Belarus | 3.2 /100 | #225 | Tragic 11.8% |
| Liberians | 3.2 /100 | #226 | Tragic 11.8% |
| Nigerians | 3.2 /100 | #227 | Tragic 11.8% |
| Immigrants | Costa Rica | 2.7 /100 | #228 | Tragic 11.8% |
| Immigrants | Eritrea | 2.6 /100 | #229 | Tragic 11.8% |
| Bermudans | 2.1 /100 | #230 | Tragic 11.9% |
| Cajuns | 2.0 /100 | #231 | Tragic 11.9% |
| Yaqui | 1.9 /100 | #232 | Tragic 11.9% |
| Panamanians | 1.8 /100 | #233 | Tragic 11.9% |
| Iroquois | 1.7 /100 | #234 | Tragic 11.9% |
| Immigrants | Argentina | 1.3 /100 | #235 | Tragic 12.0% |
| Immigrants | Peru | 1.3 /100 | #236 | Tragic 12.0% |
| Moroccans | 1.2 /100 | #237 | Tragic 12.0% |
| Seminole | 1.1 /100 | #238 | Tragic 12.0% |
| Immigrants | Spain | 1.0 /100 | #239 | Tragic 12.1% |
Demographics Similar to Immigrants from Serbia by Seniors Poverty Over the Age of 65
In terms of seniors poverty over the age of 65, the demographic groups most similar to Immigrants from Serbia are Immigrants from Norway (10.5%, a difference of 0.010%), Sierra Leonean (10.5%, a difference of 0.070%), Guamanian/Chamorro (10.5%, a difference of 0.23%), Immigrants from Australia (10.5%, a difference of 0.26%), and Immigrants from Turkey (10.5%, a difference of 0.27%).
| Demographics | Rating | Rank | Seniors Poverty Over the Age of 65 |
| Immigrants | Iran | 88.4 /100 | #129 | Excellent 10.4% |
| Immigrants | Oceania | 88.4 /100 | #130 | Excellent 10.4% |
| Egyptians | 87.8 /100 | #131 | Excellent 10.5% |
| Immigrants | Turkey | 87.7 /100 | #132 | Excellent 10.5% |
| Guamanians/Chamorros | 87.5 /100 | #133 | Excellent 10.5% |
| Sierra Leoneans | 86.8 /100 | #134 | Excellent 10.5% |
| Immigrants | Norway | 86.5 /100 | #135 | Excellent 10.5% |
| Immigrants | Serbia | 86.4 /100 | #136 | Excellent 10.5% |
| Immigrants | Australia | 85.1 /100 | #137 | Excellent 10.5% |
| Immigrants | Latvia | 84.7 /100 | #138 | Excellent 10.5% |
| Portuguese | 84.1 /100 | #139 | Excellent 10.5% |
| Immigrants | Kenya | 83.4 /100 | #140 | Excellent 10.5% |
| Immigrants | Europe | 83.3 /100 | #141 | Excellent 10.5% |
| Osage | 82.8 /100 | #142 | Excellent 10.6% |
| Immigrants | Asia | 80.8 /100 | #143 | Excellent 10.6% |