Uruguayan vs Thai Seniors Poverty Over the Age of 65
COMPARE
Uruguayan
Thai
Seniors Poverty Over the Age of 65
Seniors Poverty Over the Age of 65 Comparison
Uruguayans
Thais
12.1%
SENIORS POVERTY OVER THE AGE OF 65
0.8/ 100
METRIC RATING
243rd/ 347
METRIC RANK
9.2%
SENIORS POVERTY OVER THE AGE OF 65
99.9/ 100
METRIC RATING
20th/ 347
METRIC RANK
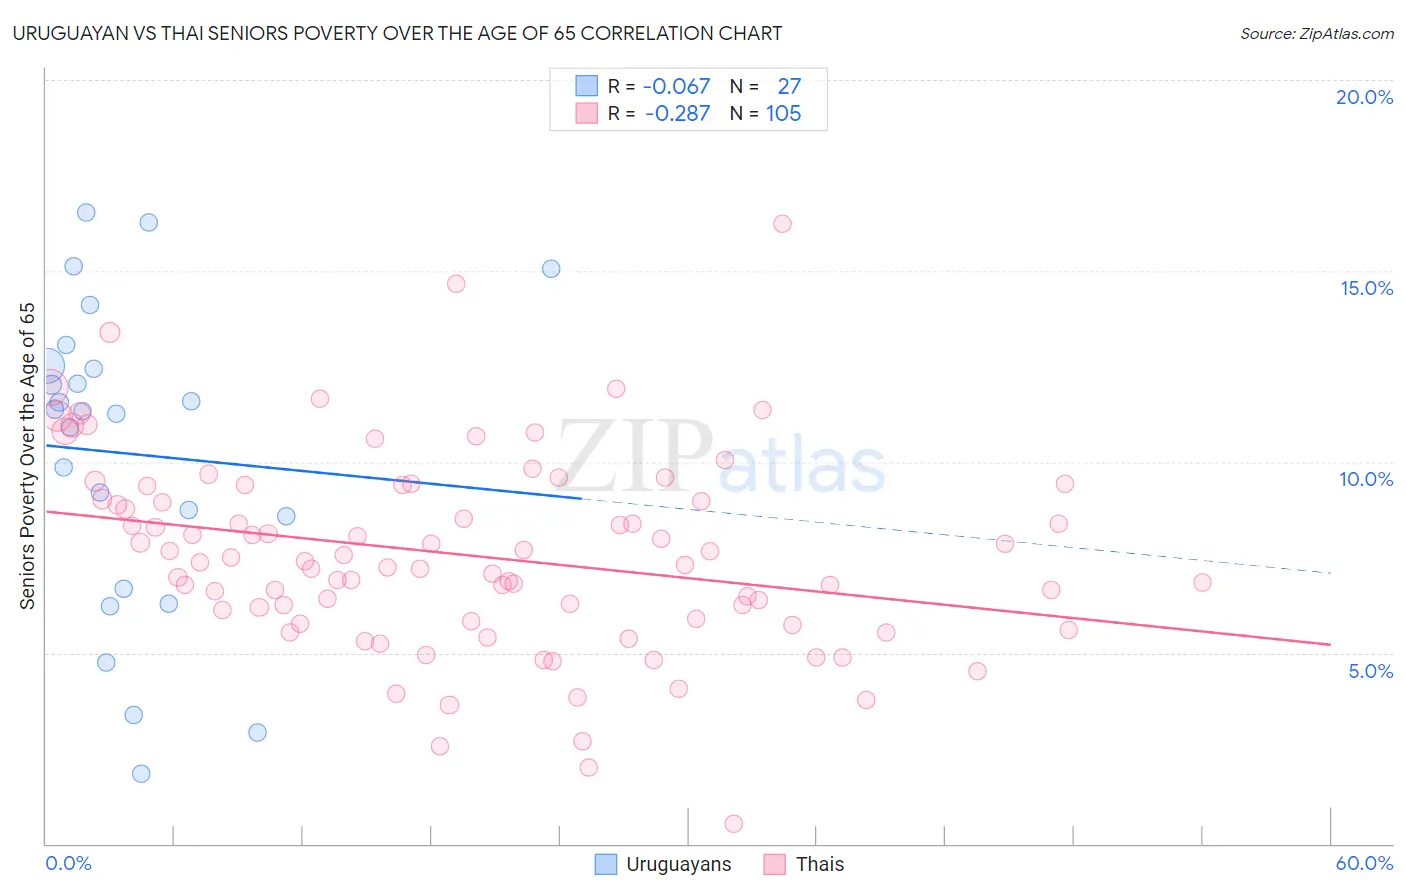
Uruguayan vs Thai Seniors Poverty Over the Age of 65 Correlation Chart
The statistical analysis conducted on geographies consisting of 144,646,384 people shows a slight negative correlation between the proportion of Uruguayans and poverty level among seniors over the age of 65 in the United States with a correlation coefficient (R) of -0.067 and weighted average of 12.1%. Similarly, the statistical analysis conducted on geographies consisting of 473,500,492 people shows a weak negative correlation between the proportion of Thais and poverty level among seniors over the age of 65 in the United States with a correlation coefficient (R) of -0.287 and weighted average of 9.2%, a difference of 31.1%.
Seniors Poverty Over the Age of 65 Correlation Summary
| Measurement | Uruguayan | Thai |
| Minimum | 1.8% | 0.53% |
| Maximum | 16.5% | 16.2% |
| Range | 14.7% | 15.7% |
| Mean | 10.2% | 7.6% |
| Median | 11.3% | 7.4% |
| Interquartile 25% (IQ1) | 6.7% | 5.9% |
| Interquartile 75% (IQ3) | 12.5% | 9.2% |
| Interquartile Range (IQR) | 5.9% | 3.3% |
| Standard Deviation (Sample) | 4.0% | 2.6% |
| Standard Deviation (Population) | 4.0% | 2.6% |
Similar Demographics by Seniors Poverty Over the Age of 65
Demographics Similar to Uruguayans by Seniors Poverty Over the Age of 65
In terms of seniors poverty over the age of 65, the demographic groups most similar to Uruguayans are Subsaharan African (12.1%, a difference of 0.12%), Immigrants from Albania (12.1%, a difference of 0.16%), Comanche (12.1%, a difference of 0.18%), Immigrants from Portugal (12.1%, a difference of 0.22%), and Immigrants from Spain (12.1%, a difference of 0.29%).
| Demographics | Rating | Rank | Seniors Poverty Over the Age of 65 |
| Immigrants | Peru | 1.3 /100 | #236 | Tragic 12.0% |
| Moroccans | 1.2 /100 | #237 | Tragic 12.0% |
| Seminole | 1.1 /100 | #238 | Tragic 12.0% |
| Immigrants | Spain | 1.0 /100 | #239 | Tragic 12.1% |
| Comanche | 0.9 /100 | #240 | Tragic 12.1% |
| Immigrants | Albania | 0.9 /100 | #241 | Tragic 12.1% |
| Sub-Saharan Africans | 0.9 /100 | #242 | Tragic 12.1% |
| Uruguayans | 0.8 /100 | #243 | Tragic 12.1% |
| Immigrants | Portugal | 0.8 /100 | #244 | Tragic 12.1% |
| Chippewa | 0.7 /100 | #245 | Tragic 12.1% |
| Cree | 0.7 /100 | #246 | Tragic 12.1% |
| Japanese | 0.6 /100 | #247 | Tragic 12.2% |
| Spanish Americans | 0.6 /100 | #248 | Tragic 12.2% |
| Ute | 0.6 /100 | #249 | Tragic 12.2% |
| Immigrants | Liberia | 0.5 /100 | #250 | Tragic 12.2% |
Demographics Similar to Thais by Seniors Poverty Over the Age of 65
In terms of seniors poverty over the age of 65, the demographic groups most similar to Thais are Swiss (9.2%, a difference of 0.14%), Luxembourger (9.2%, a difference of 0.29%), Slovene (9.3%, a difference of 0.32%), Welsh (9.3%, a difference of 0.37%), and Slovak (9.2%, a difference of 0.43%).
| Demographics | Rating | Rank | Seniors Poverty Over the Age of 65 |
| Croatians | 99.9 /100 | #13 | Exceptional 9.1% |
| Poles | 99.9 /100 | #14 | Exceptional 9.1% |
| Dutch | 99.9 /100 | #15 | Exceptional 9.1% |
| Europeans | 99.9 /100 | #16 | Exceptional 9.2% |
| Scottish | 99.9 /100 | #17 | Exceptional 9.2% |
| Slovaks | 99.9 /100 | #18 | Exceptional 9.2% |
| Swiss | 99.9 /100 | #19 | Exceptional 9.2% |
| Thais | 99.9 /100 | #20 | Exceptional 9.2% |
| Luxembourgers | 99.9 /100 | #21 | Exceptional 9.2% |
| Slovenes | 99.9 /100 | #22 | Exceptional 9.3% |
| Welsh | 99.9 /100 | #23 | Exceptional 9.3% |
| Bulgarians | 99.9 /100 | #24 | Exceptional 9.3% |
| Irish | 99.9 /100 | #25 | Exceptional 9.3% |
| Immigrants | Scotland | 99.9 /100 | #26 | Exceptional 9.3% |
| Italians | 99.9 /100 | #27 | Exceptional 9.3% |