Turkish vs Immigrants from Hungary Seniors Poverty Over the Age of 75
COMPARE
Turkish
Immigrants from Hungary
Seniors Poverty Over the Age of 75
Seniors Poverty Over the Age of 75 Comparison
Turks
Immigrants from Hungary
11.7%
SENIORS POVERTY OVER THE AGE OF 75
89.4/ 100
METRIC RATING
108th/ 347
METRIC RANK
11.8%
SENIORS POVERTY OVER THE AGE OF 75
81.7/ 100
METRIC RATING
128th/ 347
METRIC RANK
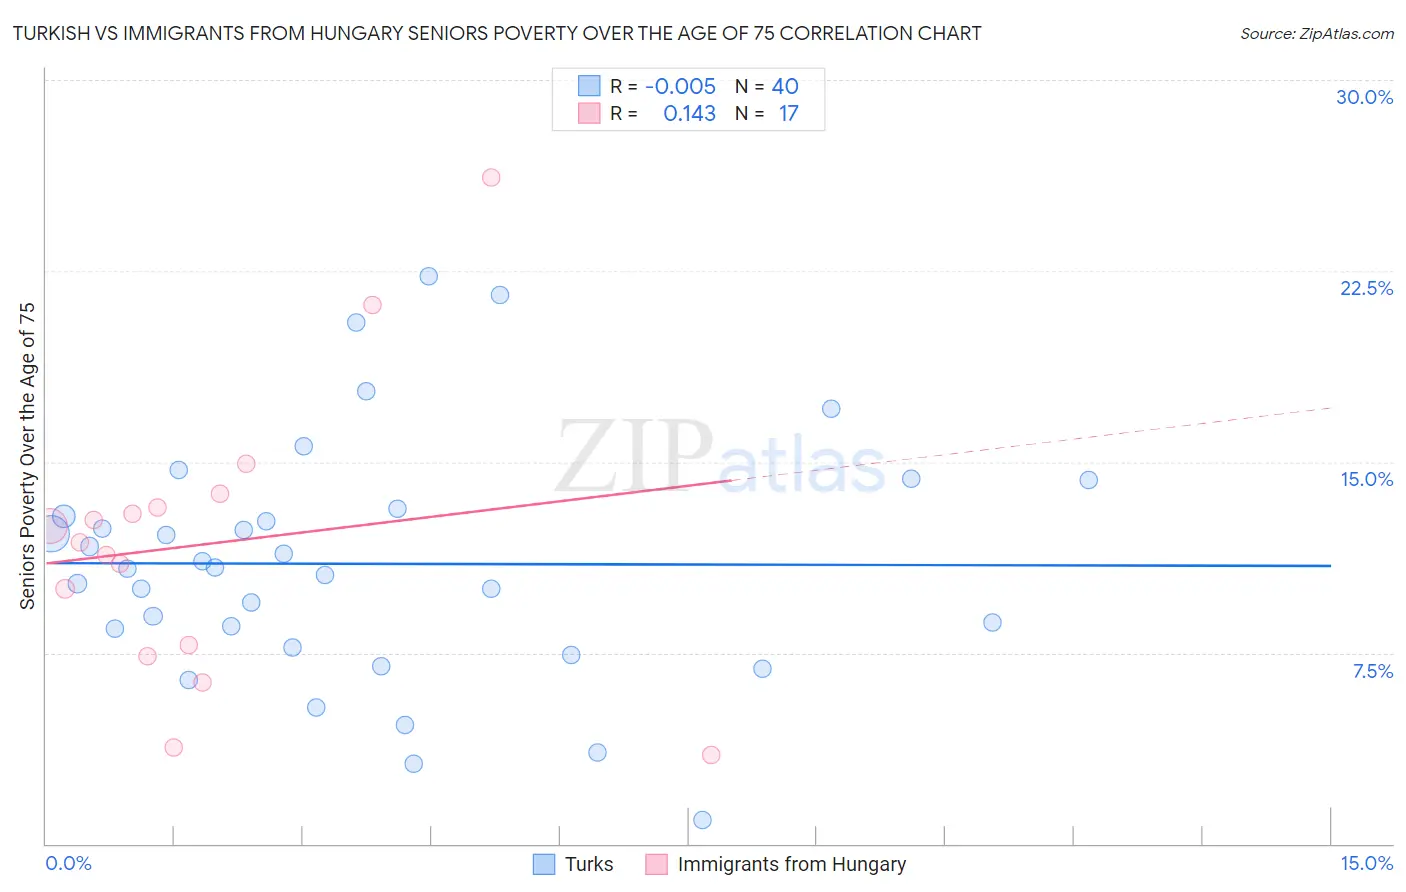
Turkish vs Immigrants from Hungary Seniors Poverty Over the Age of 75 Correlation Chart
The statistical analysis conducted on geographies consisting of 269,414,533 people shows no correlation between the proportion of Turks and poverty level among seniors over the age of 75 in the United States with a correlation coefficient (R) of -0.005 and weighted average of 11.7%. Similarly, the statistical analysis conducted on geographies consisting of 194,738,636 people shows a poor positive correlation between the proportion of Immigrants from Hungary and poverty level among seniors over the age of 75 in the United States with a correlation coefficient (R) of 0.143 and weighted average of 11.8%, a difference of 1.3%.
Seniors Poverty Over the Age of 75 Correlation Summary
| Measurement | Turkish | Immigrants from Hungary |
| Minimum | 0.93% | 3.5% |
| Maximum | 22.3% | 26.2% |
| Range | 21.4% | 22.7% |
| Mean | 11.0% | 11.8% |
| Median | 10.8% | 11.8% |
| Interquartile 25% (IQ1) | 8.1% | 7.6% |
| Interquartile 75% (IQ3) | 13.0% | 13.5% |
| Interquartile Range (IQR) | 4.9% | 5.9% |
| Standard Deviation (Sample) | 4.8% | 5.7% |
| Standard Deviation (Population) | 4.7% | 5.5% |
Demographics Similar to Turks and Immigrants from Hungary by Seniors Poverty Over the Age of 75
In terms of seniors poverty over the age of 75, the demographic groups most similar to Turks are South African (11.7%, a difference of 0.0%), Immigrants from Jordan (11.7%, a difference of 0.15%), Burmese (11.7%, a difference of 0.15%), Immigrants from Bolivia (11.7%, a difference of 0.21%), and Immigrants from Czechoslovakia (11.7%, a difference of 0.49%). Similarly, the demographic groups most similar to Immigrants from Hungary are Immigrants from Denmark (11.8%, a difference of 0.12%), Pennsylvania German (11.8%, a difference of 0.24%), Sudanese (11.8%, a difference of 0.28%), Fijian (11.8%, a difference of 0.31%), and Pakistani (11.8%, a difference of 0.34%).
| Demographics | Rating | Rank | Seniors Poverty Over the Age of 75 |
| Turks | 89.4 /100 | #108 | Excellent 11.7% |
| South Africans | 89.3 /100 | #109 | Excellent 11.7% |
| Immigrants | Jordan | 88.7 /100 | #110 | Excellent 11.7% |
| Burmese | 88.7 /100 | #111 | Excellent 11.7% |
| Immigrants | Bolivia | 88.4 /100 | #112 | Excellent 11.7% |
| Immigrants | Czechoslovakia | 87.0 /100 | #113 | Excellent 11.7% |
| Ukrainians | 86.9 /100 | #114 | Excellent 11.7% |
| New Zealanders | 86.3 /100 | #115 | Excellent 11.7% |
| Iraqis | 86.3 /100 | #116 | Excellent 11.7% |
| Icelanders | 85.7 /100 | #117 | Excellent 11.7% |
| Immigrants | Zimbabwe | 85.5 /100 | #118 | Excellent 11.7% |
| Immigrants | Uganda | 84.8 /100 | #119 | Excellent 11.8% |
| Immigrants | Nepal | 84.5 /100 | #120 | Excellent 11.8% |
| Malaysians | 84.1 /100 | #121 | Excellent 11.8% |
| Pakistanis | 84.0 /100 | #122 | Excellent 11.8% |
| Immigrants | Italy | 84.0 /100 | #123 | Excellent 11.8% |
| Fijians | 83.8 /100 | #124 | Excellent 11.8% |
| Sudanese | 83.6 /100 | #125 | Excellent 11.8% |
| Pennsylvania Germans | 83.4 /100 | #126 | Excellent 11.8% |
| Immigrants | Denmark | 82.6 /100 | #127 | Excellent 11.8% |
| Immigrants | Hungary | 81.7 /100 | #128 | Excellent 11.8% |