Taiwanese vs Immigrants from Pakistan Child Poverty Under the Age of 5
COMPARE
Taiwanese
Immigrants from Pakistan
Child Poverty Under the Age of 5
Child Poverty Under the Age of 5 Comparison
Taiwanese
Immigrants from Pakistan
14.5%
CHILD POVERTY UNDER THE AGE OF 5
99.8/ 100
METRIC RATING
33rd/ 347
METRIC RANK
14.9%
CHILD POVERTY UNDER THE AGE OF 5
99.4/ 100
METRIC RATING
56th/ 347
METRIC RANK
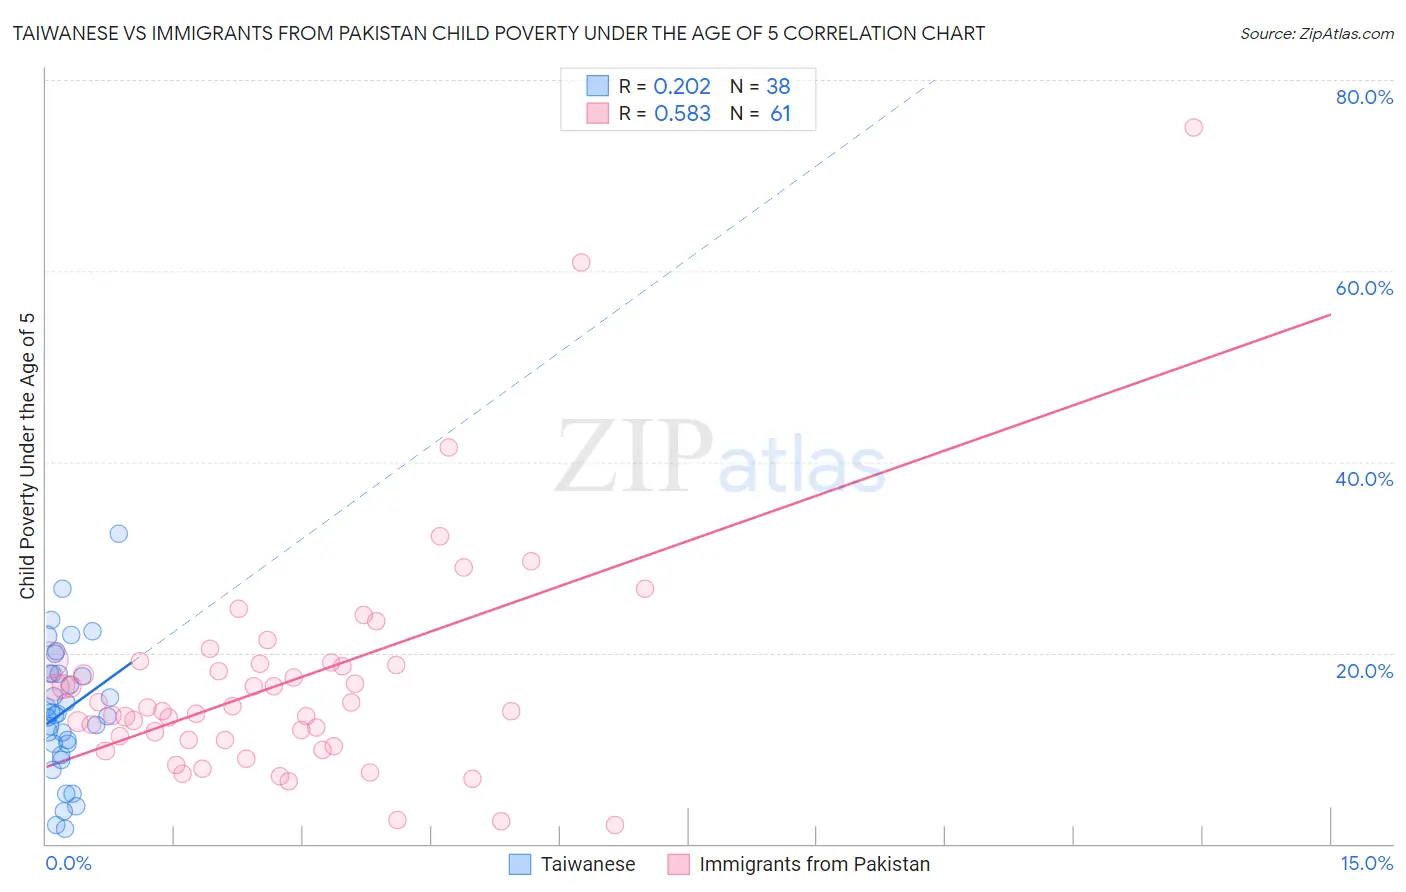
Taiwanese vs Immigrants from Pakistan Child Poverty Under the Age of 5 Correlation Chart
The statistical analysis conducted on geographies consisting of 31,513,469 people shows a weak positive correlation between the proportion of Taiwanese and poverty level among children under the age of 5 in the United States with a correlation coefficient (R) of 0.202 and weighted average of 14.5%. Similarly, the statistical analysis conducted on geographies consisting of 274,479,981 people shows a substantial positive correlation between the proportion of Immigrants from Pakistan and poverty level among children under the age of 5 in the United States with a correlation coefficient (R) of 0.583 and weighted average of 14.9%, a difference of 3.1%.
Child Poverty Under the Age of 5 Correlation Summary
| Measurement | Taiwanese | Immigrants from Pakistan |
| Minimum | 1.6% | 2.0% |
| Maximum | 32.5% | 75.0% |
| Range | 30.9% | 73.0% |
| Mean | 14.0% | 16.9% |
| Median | 13.5% | 14.3% |
| Interquartile 25% (IQ1) | 10.4% | 10.9% |
| Interquartile 75% (IQ3) | 17.8% | 18.9% |
| Interquartile Range (IQR) | 7.4% | 8.0% |
| Standard Deviation (Sample) | 6.8% | 12.0% |
| Standard Deviation (Population) | 6.8% | 11.9% |
Similar Demographics by Child Poverty Under the Age of 5
Demographics Similar to Taiwanese by Child Poverty Under the Age of 5
In terms of child poverty under the age of 5, the demographic groups most similar to Taiwanese are Immigrants from Moldova (14.5%, a difference of 0.10%), Latvian (14.5%, a difference of 0.11%), Maltese (14.5%, a difference of 0.18%), Immigrants from Sri Lanka (14.4%, a difference of 0.30%), and Turkish (14.6%, a difference of 0.52%).
| Demographics | Rating | Rank | Child Poverty Under the Age of 5 |
| Immigrants | Lithuania | 99.9 /100 | #26 | Exceptional 14.1% |
| Tongans | 99.9 /100 | #27 | Exceptional 14.2% |
| Immigrants | Indonesia | 99.8 /100 | #28 | Exceptional 14.3% |
| Immigrants | Asia | 99.8 /100 | #29 | Exceptional 14.4% |
| Cambodians | 99.8 /100 | #30 | Exceptional 14.4% |
| Koreans | 99.8 /100 | #31 | Exceptional 14.4% |
| Immigrants | Sri Lanka | 99.8 /100 | #32 | Exceptional 14.4% |
| Taiwanese | 99.8 /100 | #33 | Exceptional 14.5% |
| Immigrants | Moldova | 99.8 /100 | #34 | Exceptional 14.5% |
| Latvians | 99.8 /100 | #35 | Exceptional 14.5% |
| Maltese | 99.8 /100 | #36 | Exceptional 14.5% |
| Turks | 99.7 /100 | #37 | Exceptional 14.6% |
| Eastern Europeans | 99.7 /100 | #38 | Exceptional 14.6% |
| Norwegians | 99.7 /100 | #39 | Exceptional 14.6% |
| Immigrants | Australia | 99.7 /100 | #40 | Exceptional 14.6% |
Demographics Similar to Immigrants from Pakistan by Child Poverty Under the Age of 5
In terms of child poverty under the age of 5, the demographic groups most similar to Immigrants from Pakistan are Danish (14.9%, a difference of 0.070%), Egyptian (14.9%, a difference of 0.080%), Immigrants from Israel (14.9%, a difference of 0.13%), Swedish (15.0%, a difference of 0.13%), and Luxembourger (14.9%, a difference of 0.14%).
| Demographics | Rating | Rank | Child Poverty Under the Age of 5 |
| Immigrants | Bulgaria | 99.6 /100 | #49 | Exceptional 14.8% |
| Immigrants | Northern Europe | 99.6 /100 | #50 | Exceptional 14.8% |
| Estonians | 99.6 /100 | #51 | Exceptional 14.8% |
| Immigrants | Serbia | 99.5 /100 | #52 | Exceptional 14.9% |
| Luxembourgers | 99.4 /100 | #53 | Exceptional 14.9% |
| Immigrants | Israel | 99.4 /100 | #54 | Exceptional 14.9% |
| Danes | 99.4 /100 | #55 | Exceptional 14.9% |
| Immigrants | Pakistan | 99.4 /100 | #56 | Exceptional 14.9% |
| Egyptians | 99.4 /100 | #57 | Exceptional 14.9% |
| Swedes | 99.4 /100 | #58 | Exceptional 15.0% |
| Paraguayans | 99.4 /100 | #59 | Exceptional 15.0% |
| Immigrants | Russia | 99.3 /100 | #60 | Exceptional 15.0% |
| Immigrants | Poland | 99.1 /100 | #61 | Exceptional 15.1% |
| Immigrants | Eastern Europe | 99.1 /100 | #62 | Exceptional 15.1% |
| Immigrants | Europe | 99.1 /100 | #63 | Exceptional 15.1% |