Sudanese vs Immigrants from Venezuela Child Poverty Among Boys Under 16
COMPARE
Sudanese
Immigrants from Venezuela
Child Poverty Among Boys Under 16
Child Poverty Among Boys Under 16 Comparison
Sudanese
Immigrants from Venezuela
18.6%
CHILD POVERTY AMONG BOYS UNDER 16
0.9/ 100
METRIC RATING
236th/ 347
METRIC RANK
15.8%
CHILD POVERTY AMONG BOYS UNDER 16
79.5/ 100
METRIC RATING
152nd/ 347
METRIC RANK
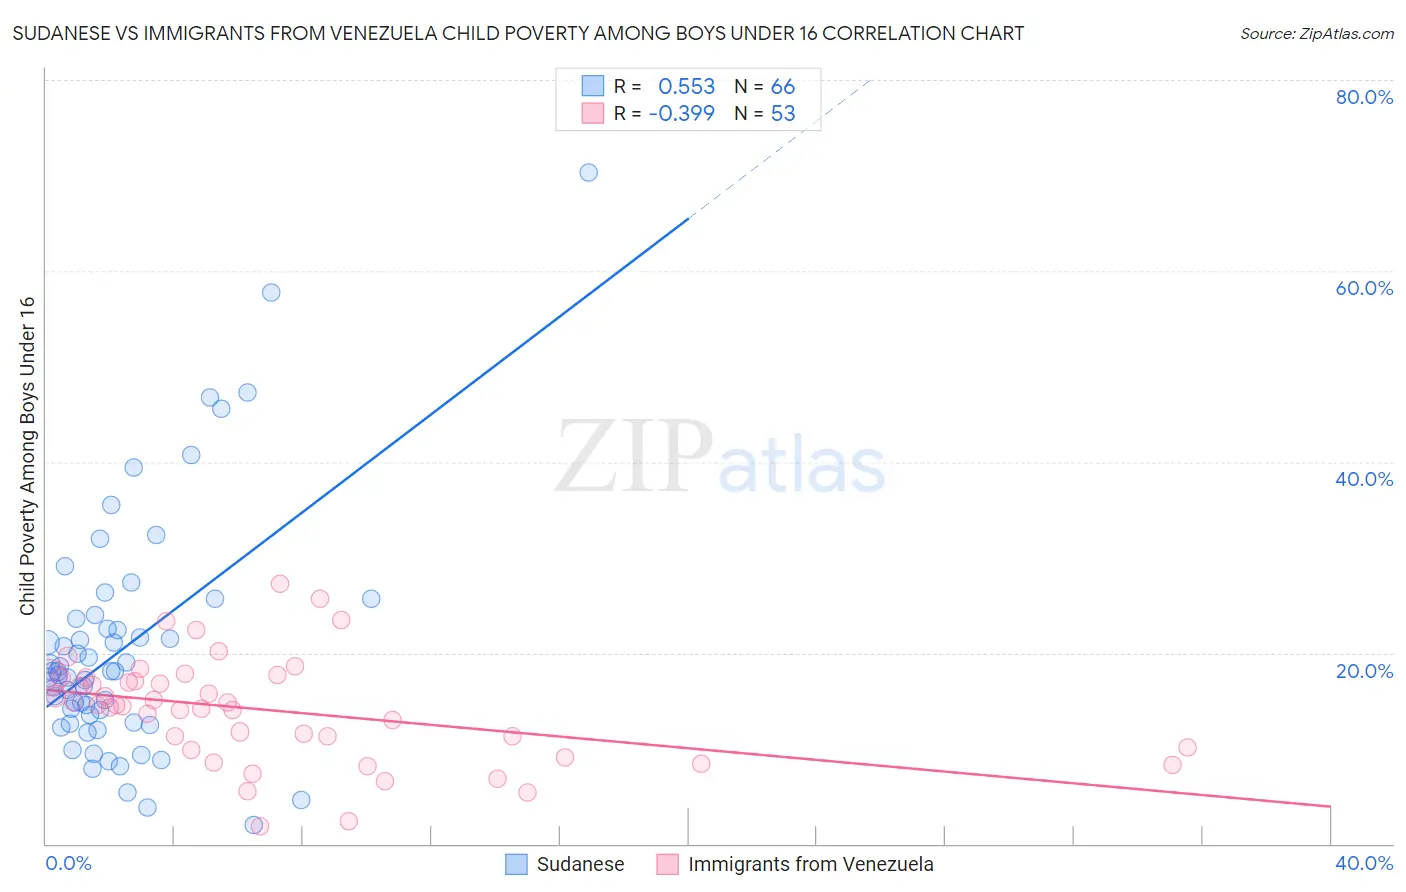
Sudanese vs Immigrants from Venezuela Child Poverty Among Boys Under 16 Correlation Chart
The statistical analysis conducted on geographies consisting of 109,878,715 people shows a substantial positive correlation between the proportion of Sudanese and poverty level among boys under the age of 16 in the United States with a correlation coefficient (R) of 0.553 and weighted average of 18.6%. Similarly, the statistical analysis conducted on geographies consisting of 285,017,415 people shows a mild negative correlation between the proportion of Immigrants from Venezuela and poverty level among boys under the age of 16 in the United States with a correlation coefficient (R) of -0.399 and weighted average of 15.8%, a difference of 17.6%.
Child Poverty Among Boys Under 16 Correlation Summary
| Measurement | Sudanese | Immigrants from Venezuela |
| Minimum | 2.0% | 1.9% |
| Maximum | 70.3% | 27.2% |
| Range | 68.3% | 25.3% |
| Mean | 20.5% | 14.0% |
| Median | 18.0% | 14.5% |
| Interquartile 25% (IQ1) | 12.7% | 9.9% |
| Interquartile 75% (IQ3) | 23.6% | 17.4% |
| Interquartile Range (IQR) | 10.9% | 7.5% |
| Standard Deviation (Sample) | 12.6% | 5.5% |
| Standard Deviation (Population) | 12.5% | 5.5% |
Similar Demographics by Child Poverty Among Boys Under 16
Demographics Similar to Sudanese by Child Poverty Among Boys Under 16
In terms of child poverty among boys under 16, the demographic groups most similar to Sudanese are American (18.6%, a difference of 0.090%), Immigrants from Eritrea (18.6%, a difference of 0.15%), Immigrants from Laos (18.7%, a difference of 0.37%), Nigerian (18.5%, a difference of 0.59%), and Cape Verdean (18.7%, a difference of 0.61%).
| Demographics | Rating | Rank | Child Poverty Among Boys Under 16 |
| Immigrants | Micronesia | 1.8 /100 | #229 | Tragic 18.3% |
| Fijians | 1.8 /100 | #230 | Tragic 18.3% |
| Nicaraguans | 1.4 /100 | #231 | Tragic 18.4% |
| Marshallese | 1.3 /100 | #232 | Tragic 18.4% |
| Immigrants | Nigeria | 1.2 /100 | #233 | Tragic 18.4% |
| Nigerians | 1.1 /100 | #234 | Tragic 18.5% |
| Americans | 0.9 /100 | #235 | Tragic 18.6% |
| Sudanese | 0.9 /100 | #236 | Tragic 18.6% |
| Immigrants | Eritrea | 0.8 /100 | #237 | Tragic 18.6% |
| Immigrants | Laos | 0.8 /100 | #238 | Tragic 18.7% |
| Cape Verdeans | 0.7 /100 | #239 | Tragic 18.7% |
| Immigrants | Cuba | 0.6 /100 | #240 | Tragic 18.8% |
| Immigrants | Sudan | 0.6 /100 | #241 | Tragic 18.8% |
| Ghanaians | 0.5 /100 | #242 | Tragic 18.9% |
| Immigrants | Azores | 0.4 /100 | #243 | Tragic 18.9% |
Demographics Similar to Immigrants from Venezuela by Child Poverty Among Boys Under 16
In terms of child poverty among boys under 16, the demographic groups most similar to Immigrants from Venezuela are Puget Sound Salish (15.8%, a difference of 0.050%), Immigrants from Jordan (15.8%, a difference of 0.13%), Slovak (15.8%, a difference of 0.14%), French (15.8%, a difference of 0.14%), and Brazilian (15.8%, a difference of 0.28%).
| Demographics | Rating | Rank | Child Poverty Among Boys Under 16 |
| Samoans | 83.2 /100 | #145 | Excellent 15.7% |
| New Zealanders | 82.4 /100 | #146 | Excellent 15.7% |
| Venezuelans | 82.1 /100 | #147 | Excellent 15.7% |
| Brazilians | 81.0 /100 | #148 | Excellent 15.8% |
| Slovaks | 80.3 /100 | #149 | Excellent 15.8% |
| Immigrants | Jordan | 80.2 /100 | #150 | Excellent 15.8% |
| Puget Sound Salish | 79.8 /100 | #151 | Good 15.8% |
| Immigrants | Venezuela | 79.5 /100 | #152 | Good 15.8% |
| French | 78.7 /100 | #153 | Good 15.8% |
| Syrians | 77.5 /100 | #154 | Good 15.9% |
| French Canadians | 76.6 /100 | #155 | Good 15.9% |
| Israelis | 76.5 /100 | #156 | Good 15.9% |
| Immigrants | Nepal | 76.0 /100 | #157 | Good 15.9% |
| Yugoslavians | 75.9 /100 | #158 | Good 15.9% |
| Immigrants | Chile | 74.8 /100 | #159 | Good 15.9% |