Spanish American vs Ute Seniors Poverty Over the Age of 65
COMPARE
Spanish American
Ute
Seniors Poverty Over the Age of 65
Seniors Poverty Over the Age of 65 Comparison
Spanish Americans
Ute
12.2%
SENIORS POVERTY OVER THE AGE OF 65
0.6/ 100
METRIC RATING
248th/ 347
METRIC RANK
12.2%
SENIORS POVERTY OVER THE AGE OF 65
0.6/ 100
METRIC RATING
249th/ 347
METRIC RANK
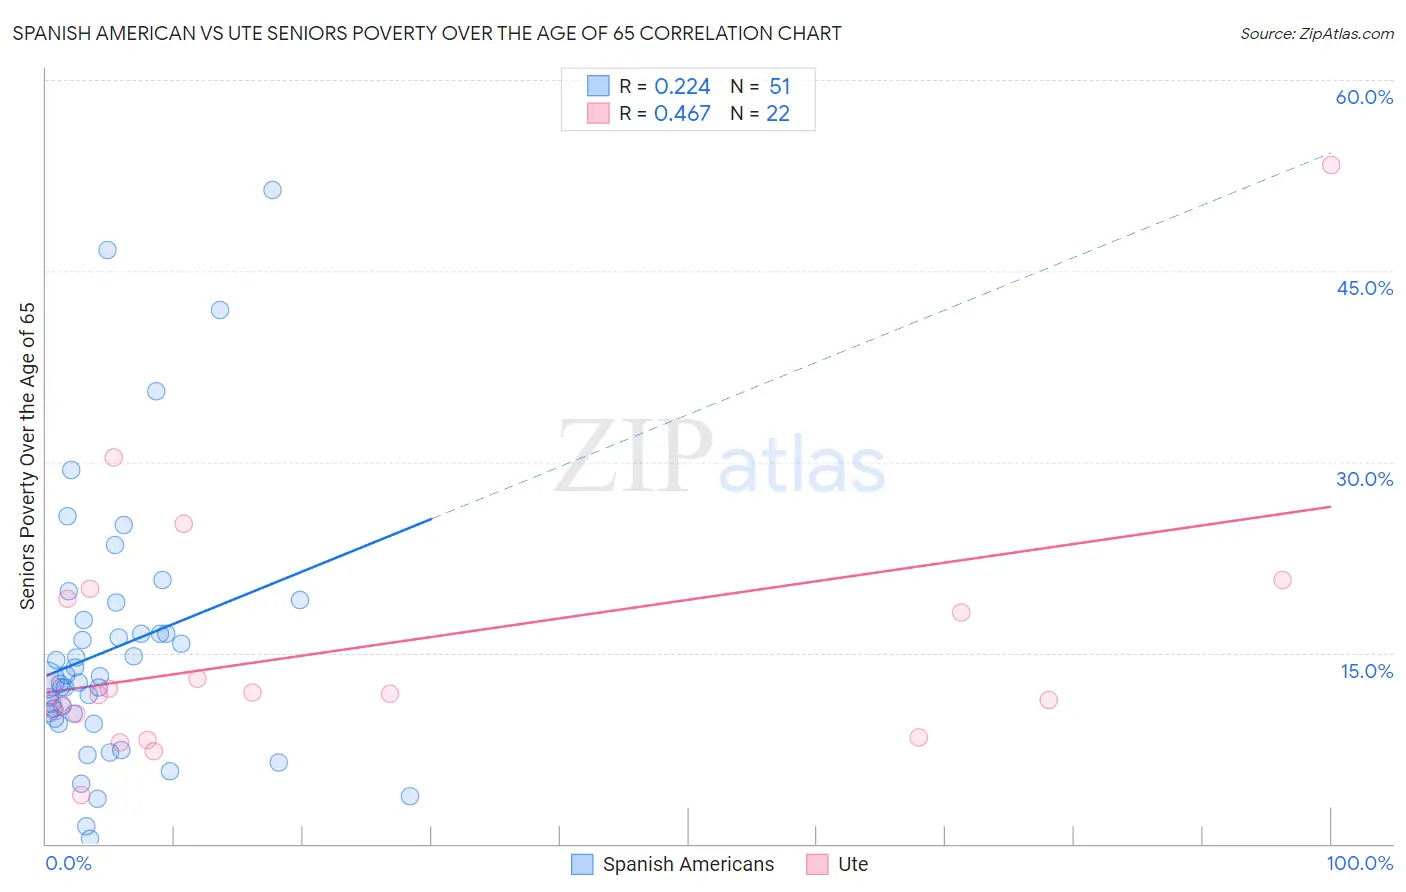
Spanish American vs Ute Seniors Poverty Over the Age of 65 Correlation Chart
The statistical analysis conducted on geographies consisting of 103,122,347 people shows a weak positive correlation between the proportion of Spanish Americans and poverty level among seniors over the age of 65 in the United States with a correlation coefficient (R) of 0.224 and weighted average of 12.2%. Similarly, the statistical analysis conducted on geographies consisting of 55,563,330 people shows a moderate positive correlation between the proportion of Ute and poverty level among seniors over the age of 65 in the United States with a correlation coefficient (R) of 0.467 and weighted average of 12.2%, a difference of 0.050%.
Seniors Poverty Over the Age of 65 Correlation Summary
| Measurement | Spanish American | Ute |
| Minimum | 0.42% | 3.8% |
| Maximum | 51.4% | 53.3% |
| Range | 50.9% | 49.5% |
| Mean | 15.4% | 15.4% |
| Median | 12.8% | 11.8% |
| Interquartile 25% (IQ1) | 9.8% | 10.2% |
| Interquartile 75% (IQ3) | 17.5% | 19.2% |
| Interquartile Range (IQR) | 7.7% | 9.0% |
| Standard Deviation (Sample) | 10.4% | 10.6% |
| Standard Deviation (Population) | 10.3% | 10.3% |
Demographics Similar to Spanish Americans and Ute by Seniors Poverty Over the Age of 65
In terms of seniors poverty over the age of 65, the demographic groups most similar to Spanish Americans are Japanese (12.2%, a difference of 0.010%), Cree (12.1%, a difference of 0.12%), Chippewa (12.1%, a difference of 0.23%), Immigrants from Portugal (12.1%, a difference of 0.34%), and Immigrants from Liberia (12.2%, a difference of 0.43%). Similarly, the demographic groups most similar to Ute are Japanese (12.2%, a difference of 0.060%), Cree (12.1%, a difference of 0.17%), Chippewa (12.1%, a difference of 0.28%), Immigrants from Liberia (12.2%, a difference of 0.38%), and Immigrants from Portugal (12.1%, a difference of 0.39%).
| Demographics | Rating | Rank | Seniors Poverty Over the Age of 65 |
| Seminole | 1.1 /100 | #238 | Tragic 12.0% |
| Immigrants | Spain | 1.0 /100 | #239 | Tragic 12.1% |
| Comanche | 0.9 /100 | #240 | Tragic 12.1% |
| Immigrants | Albania | 0.9 /100 | #241 | Tragic 12.1% |
| Sub-Saharan Africans | 0.9 /100 | #242 | Tragic 12.1% |
| Uruguayans | 0.8 /100 | #243 | Tragic 12.1% |
| Immigrants | Portugal | 0.8 /100 | #244 | Tragic 12.1% |
| Chippewa | 0.7 /100 | #245 | Tragic 12.1% |
| Cree | 0.7 /100 | #246 | Tragic 12.1% |
| Japanese | 0.6 /100 | #247 | Tragic 12.2% |
| Spanish Americans | 0.6 /100 | #248 | Tragic 12.2% |
| Ute | 0.6 /100 | #249 | Tragic 12.2% |
| Immigrants | Liberia | 0.5 /100 | #250 | Tragic 12.2% |
| Somalis | 0.3 /100 | #251 | Tragic 12.3% |
| Armenians | 0.3 /100 | #252 | Tragic 12.3% |
| Shoshone | 0.3 /100 | #253 | Tragic 12.3% |
| Immigrants | Cambodia | 0.3 /100 | #254 | Tragic 12.4% |
| Mexican American Indians | 0.3 /100 | #255 | Tragic 12.4% |
| Immigrants | Panama | 0.2 /100 | #256 | Tragic 12.4% |
| Immigrants | Immigrants | 0.2 /100 | #257 | Tragic 12.4% |
| Dutch West Indians | 0.2 /100 | #258 | Tragic 12.4% |