Spanish American vs Danish Single Male Poverty
COMPARE
Spanish American
Danish
Single Male Poverty
Single Male Poverty Comparison
Spanish Americans
Danes
14.2%
SINGLE MALE POVERTY
0.0/ 100
METRIC RATING
282nd/ 347
METRIC RANK
12.8%
SINGLE MALE POVERTY
51.4/ 100
METRIC RATING
172nd/ 347
METRIC RANK
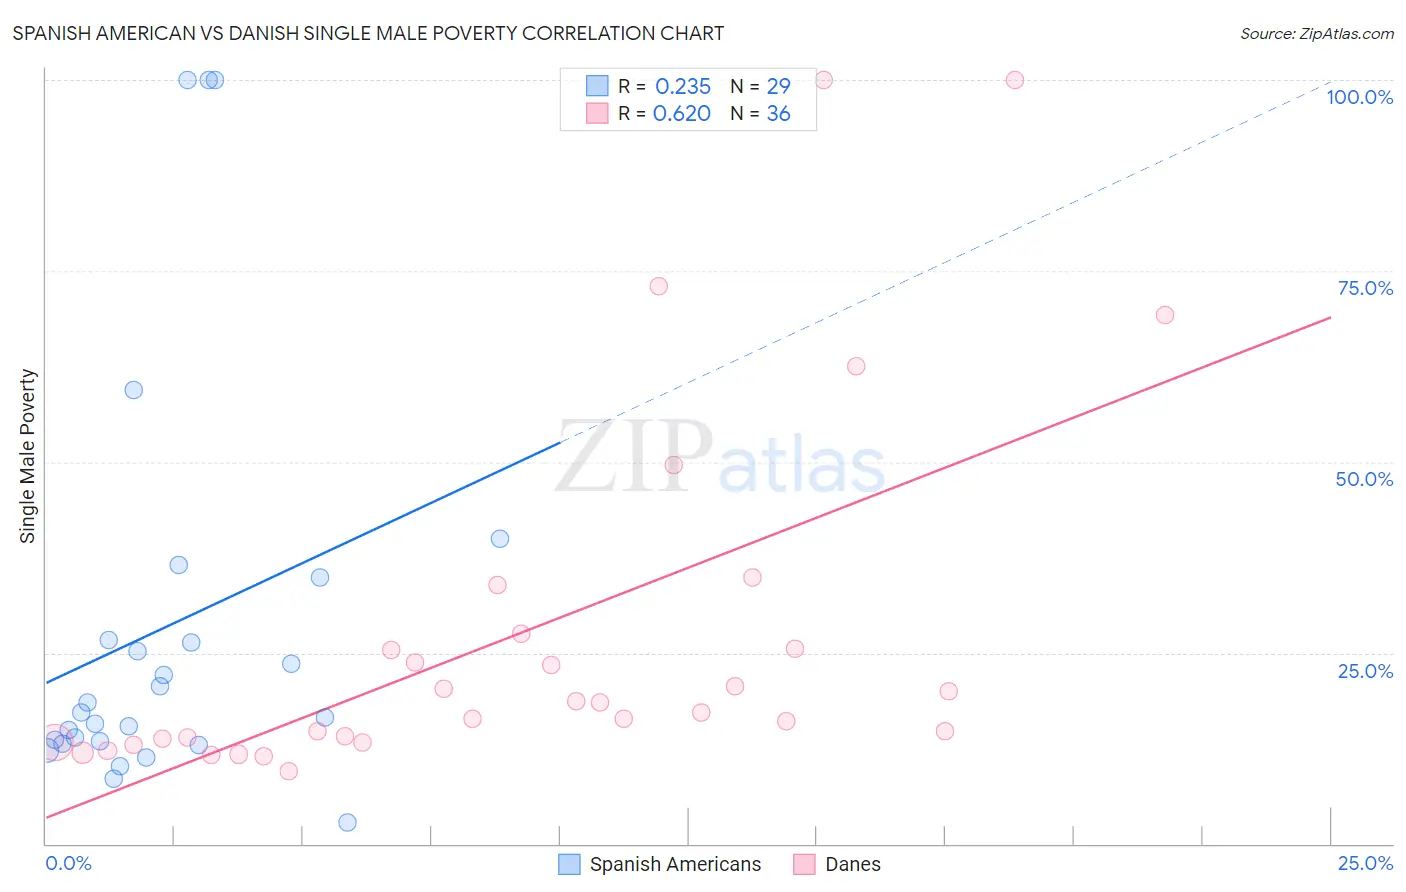
Spanish American vs Danish Single Male Poverty Correlation Chart
The statistical analysis conducted on geographies consisting of 100,269,530 people shows a weak positive correlation between the proportion of Spanish Americans and poverty level among single males in the United States with a correlation coefficient (R) of 0.235 and weighted average of 14.2%. Similarly, the statistical analysis conducted on geographies consisting of 403,172,757 people shows a significant positive correlation between the proportion of Danes and poverty level among single males in the United States with a correlation coefficient (R) of 0.620 and weighted average of 12.8%, a difference of 11.2%.
Single Male Poverty Correlation Summary
| Measurement | Spanish American | Danish |
| Minimum | 2.8% | 9.5% |
| Maximum | 100.0% | 100.0% |
| Range | 97.2% | 90.5% |
| Mean | 28.5% | 27.5% |
| Median | 17.2% | 17.9% |
| Interquartile 25% (IQ1) | 13.2% | 13.5% |
| Interquartile 75% (IQ3) | 30.7% | 26.5% |
| Interquartile Range (IQR) | 17.5% | 13.0% |
| Standard Deviation (Sample) | 27.2% | 23.9% |
| Standard Deviation (Population) | 26.7% | 23.6% |
Similar Demographics by Single Male Poverty
Demographics Similar to Spanish Americans by Single Male Poverty
In terms of single male poverty, the demographic groups most similar to Spanish Americans are Hispanic or Latino (14.2%, a difference of 0.16%), Yaqui (14.2%, a difference of 0.16%), Hmong (14.2%, a difference of 0.18%), Indonesian (14.1%, a difference of 0.89%), and Slovak (14.1%, a difference of 0.93%).
| Demographics | Rating | Rank | Single Male Poverty |
| English | 0.1 /100 | #275 | Tragic 14.1% |
| Dutch | 0.1 /100 | #276 | Tragic 14.1% |
| Immigrants | Honduras | 0.0 /100 | #277 | Tragic 14.1% |
| Slovaks | 0.0 /100 | #278 | Tragic 14.1% |
| Indonesians | 0.0 /100 | #279 | Tragic 14.1% |
| Hmong | 0.0 /100 | #280 | Tragic 14.2% |
| Hispanics or Latinos | 0.0 /100 | #281 | Tragic 14.2% |
| Spanish Americans | 0.0 /100 | #282 | Tragic 14.2% |
| Yaqui | 0.0 /100 | #283 | Tragic 14.2% |
| Immigrants | Bahamas | 0.0 /100 | #284 | Tragic 14.4% |
| French | 0.0 /100 | #285 | Tragic 14.4% |
| Celtics | 0.0 /100 | #286 | Tragic 14.5% |
| Iroquois | 0.0 /100 | #287 | Tragic 14.5% |
| Whites/Caucasians | 0.0 /100 | #288 | Tragic 14.5% |
| Immigrants | Dominica | 0.0 /100 | #289 | Tragic 14.5% |
Demographics Similar to Danes by Single Male Poverty
In terms of single male poverty, the demographic groups most similar to Danes are South African (12.8%, a difference of 0.0%), Guyanese (12.8%, a difference of 0.030%), Immigrants from St. Vincent and the Grenadines (12.8%, a difference of 0.030%), Costa Rican (12.8%, a difference of 0.080%), and Croatian (12.8%, a difference of 0.14%).
| Demographics | Rating | Rank | Single Male Poverty |
| Immigrants | Cambodia | 62.2 /100 | #165 | Good 12.7% |
| Immigrants | Guyana | 60.5 /100 | #166 | Good 12.7% |
| Immigrants | Sudan | 58.2 /100 | #167 | Average 12.7% |
| Immigrants | Barbados | 57.7 /100 | #168 | Average 12.7% |
| Puget Sound Salish | 54.3 /100 | #169 | Average 12.8% |
| Guyanese | 52.0 /100 | #170 | Average 12.8% |
| South Africans | 51.5 /100 | #171 | Average 12.8% |
| Danes | 51.4 /100 | #172 | Average 12.8% |
| Immigrants | St. Vincent and the Grenadines | 50.9 /100 | #173 | Average 12.8% |
| Costa Ricans | 50.0 /100 | #174 | Average 12.8% |
| Croatians | 48.9 /100 | #175 | Average 12.8% |
| Syrians | 48.4 /100 | #176 | Average 12.8% |
| Immigrants | Canada | 44.8 /100 | #177 | Average 12.8% |
| Immigrants | Switzerland | 43.1 /100 | #178 | Average 12.8% |
| Israelis | 41.0 /100 | #179 | Average 12.9% |