Spanish American Indian vs Armenian Child Poverty Among Boys Under 16
COMPARE
Spanish American Indian
Armenian
Child Poverty Among Boys Under 16
Child Poverty Among Boys Under 16 Comparison
Spanish American Indians
Armenians
19.6%
CHILD POVERTY AMONG BOYS UNDER 16
0.1/ 100
METRIC RATING
268th/ 347
METRIC RANK
15.2%
CHILD POVERTY AMONG BOYS UNDER 16
93.6/ 100
METRIC RATING
115th/ 347
METRIC RANK
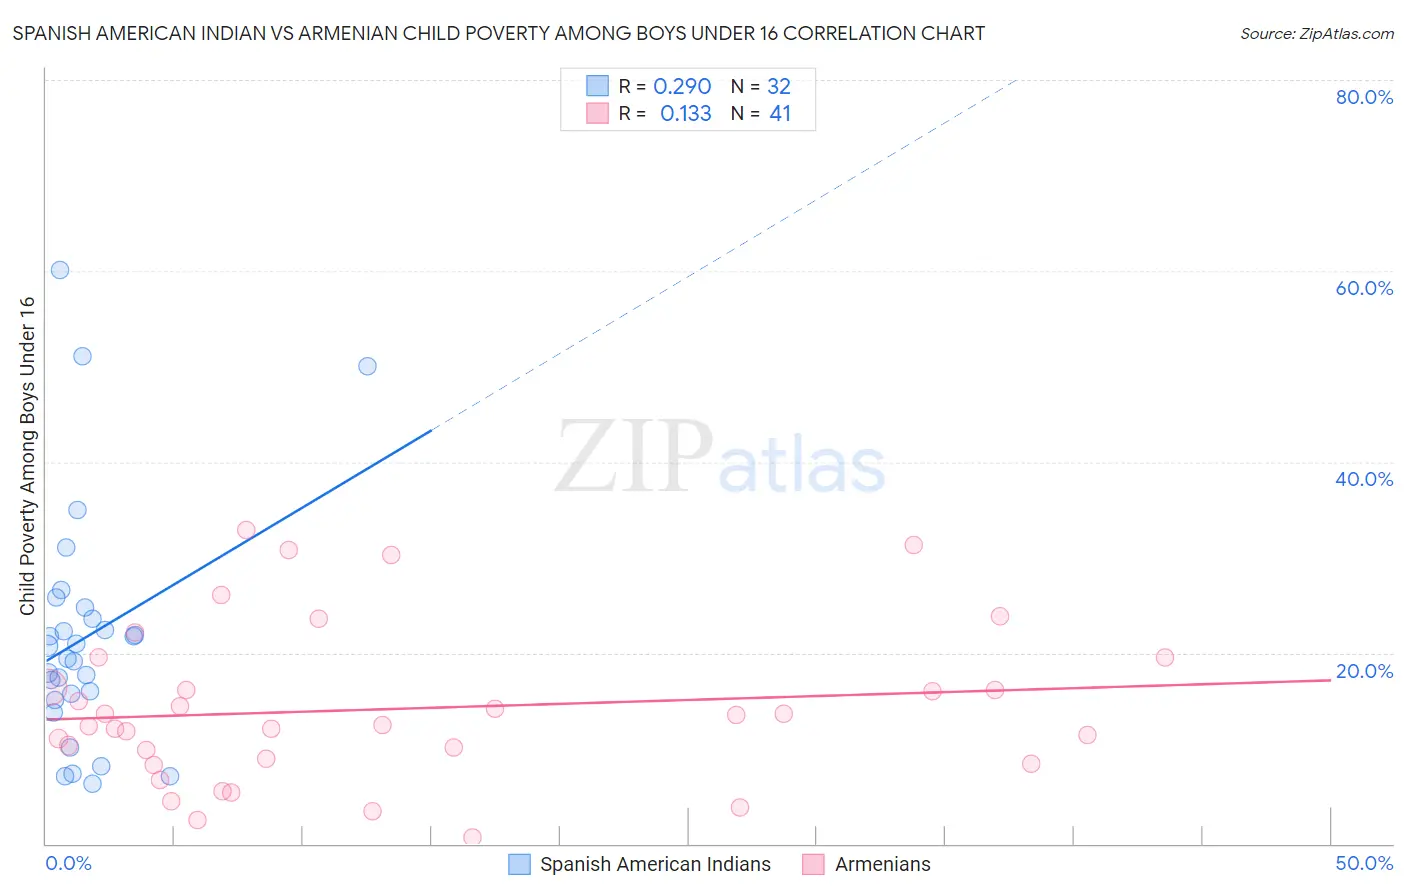
Spanish American Indian vs Armenian Child Poverty Among Boys Under 16 Correlation Chart
The statistical analysis conducted on geographies consisting of 72,998,079 people shows a weak positive correlation between the proportion of Spanish American Indians and poverty level among boys under the age of 16 in the United States with a correlation coefficient (R) of 0.290 and weighted average of 19.6%. Similarly, the statistical analysis conducted on geographies consisting of 305,566,477 people shows a poor positive correlation between the proportion of Armenians and poverty level among boys under the age of 16 in the United States with a correlation coefficient (R) of 0.133 and weighted average of 15.2%, a difference of 29.0%.
Child Poverty Among Boys Under 16 Correlation Summary
| Measurement | Spanish American Indian | Armenian |
| Minimum | 6.3% | 0.62% |
| Maximum | 60.1% | 32.8% |
| Range | 53.8% | 32.2% |
| Mean | 21.7% | 14.1% |
| Median | 20.0% | 12.5% |
| Interquartile 25% (IQ1) | 15.4% | 8.6% |
| Interquartile 75% (IQ3) | 24.2% | 17.9% |
| Interquartile Range (IQR) | 8.8% | 9.3% |
| Standard Deviation (Sample) | 12.6% | 8.2% |
| Standard Deviation (Population) | 12.4% | 8.1% |
Similar Demographics by Child Poverty Among Boys Under 16
Demographics Similar to Spanish American Indians by Child Poverty Among Boys Under 16
In terms of child poverty among boys under 16, the demographic groups most similar to Spanish American Indians are Vietnamese (19.6%, a difference of 0.11%), Immigrants from El Salvador (19.6%, a difference of 0.12%), Immigrants from Cabo Verde (19.7%, a difference of 0.16%), Guyanese (19.6%, a difference of 0.17%), and Iroquois (19.6%, a difference of 0.26%).
| Demographics | Rating | Rank | Child Poverty Among Boys Under 16 |
| Immigrants | Ghana | 0.2 /100 | #261 | Tragic 19.4% |
| Immigrants | Guyana | 0.1 /100 | #262 | Tragic 19.5% |
| Ottawa | 0.1 /100 | #263 | Tragic 19.5% |
| Iroquois | 0.1 /100 | #264 | Tragic 19.6% |
| Guyanese | 0.1 /100 | #265 | Tragic 19.6% |
| Immigrants | El Salvador | 0.1 /100 | #266 | Tragic 19.6% |
| Vietnamese | 0.1 /100 | #267 | Tragic 19.6% |
| Spanish American Indians | 0.1 /100 | #268 | Tragic 19.6% |
| Immigrants | Cabo Verde | 0.1 /100 | #269 | Tragic 19.7% |
| Cherokee | 0.1 /100 | #270 | Tragic 19.7% |
| Chickasaw | 0.1 /100 | #271 | Tragic 19.8% |
| Immigrants | Ecuador | 0.1 /100 | #272 | Tragic 19.8% |
| Belizeans | 0.1 /100 | #273 | Tragic 19.9% |
| Immigrants | Bangladesh | 0.0 /100 | #274 | Tragic 19.9% |
| Jamaicans | 0.0 /100 | #275 | Tragic 20.0% |
Demographics Similar to Armenians by Child Poverty Among Boys Under 16
In terms of child poverty among boys under 16, the demographic groups most similar to Armenians are Immigrants from Ukraine (15.2%, a difference of 0.010%), Immigrants from South Eastern Asia (15.2%, a difference of 0.040%), Irish (15.2%, a difference of 0.070%), Immigrants from Vietnam (15.2%, a difference of 0.070%), and Basque (15.2%, a difference of 0.10%).
| Demographics | Rating | Rank | Child Poverty Among Boys Under 16 |
| Immigrants | England | 94.8 /100 | #108 | Exceptional 15.1% |
| Pakistanis | 94.7 /100 | #109 | Exceptional 15.1% |
| English | 94.3 /100 | #110 | Exceptional 15.1% |
| Immigrants | Zimbabwe | 94.2 /100 | #111 | Exceptional 15.2% |
| Basques | 93.8 /100 | #112 | Exceptional 15.2% |
| Irish | 93.8 /100 | #113 | Exceptional 15.2% |
| Immigrants | Ukraine | 93.6 /100 | #114 | Exceptional 15.2% |
| Armenians | 93.6 /100 | #115 | Exceptional 15.2% |
| Immigrants | South Eastern Asia | 93.5 /100 | #116 | Exceptional 15.2% |
| Immigrants | Vietnam | 93.5 /100 | #117 | Exceptional 15.2% |
| Native Hawaiians | 93.4 /100 | #118 | Exceptional 15.2% |
| Belgians | 93.1 /100 | #119 | Exceptional 15.2% |
| South Africans | 93.0 /100 | #120 | Exceptional 15.2% |
| Scottish | 93.0 /100 | #121 | Exceptional 15.2% |
| Immigrants | Malaysia | 92.8 /100 | #122 | Exceptional 15.3% |