South American vs Immigrants from Lithuania Child Poverty Under the Age of 16
COMPARE
South American
Immigrants from Lithuania
Child Poverty Under the Age of 16
Child Poverty Under the Age of 16 Comparison
South Americans
Immigrants from Lithuania
16.0%
CHILD POVERTY UNDER THE AGE OF 16
57.9/ 100
METRIC RATING
168th/ 347
METRIC RANK
12.9%
CHILD POVERTY UNDER THE AGE OF 16
99.9/ 100
METRIC RATING
14th/ 347
METRIC RANK
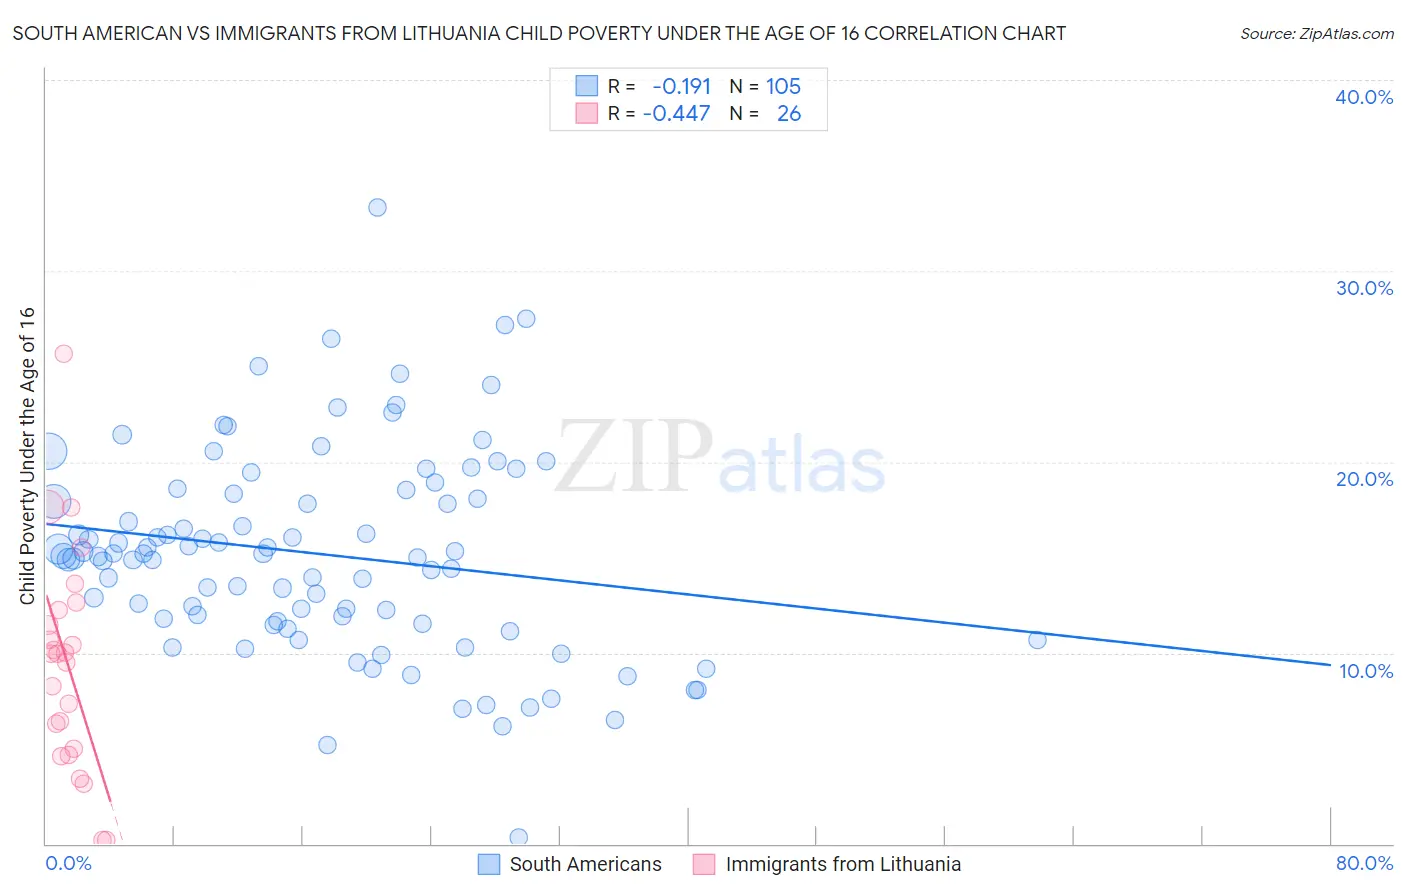
South American vs Immigrants from Lithuania Child Poverty Under the Age of 16 Correlation Chart
The statistical analysis conducted on geographies consisting of 487,399,793 people shows a poor negative correlation between the proportion of South Americans and poverty level among children under the age of 16 in the United States with a correlation coefficient (R) of -0.191 and weighted average of 16.0%. Similarly, the statistical analysis conducted on geographies consisting of 117,283,790 people shows a moderate negative correlation between the proportion of Immigrants from Lithuania and poverty level among children under the age of 16 in the United States with a correlation coefficient (R) of -0.447 and weighted average of 12.9%, a difference of 24.3%.
Child Poverty Under the Age of 16 Correlation Summary
| Measurement | South American | Immigrants from Lithuania |
| Minimum | 0.32% | 0.17% |
| Maximum | 33.3% | 25.6% |
| Range | 33.0% | 25.5% |
| Mean | 15.2% | 9.5% |
| Median | 15.1% | 9.9% |
| Interquartile 25% (IQ1) | 11.6% | 5.0% |
| Interquartile 75% (IQ3) | 18.4% | 12.2% |
| Interquartile Range (IQR) | 6.8% | 7.2% |
| Standard Deviation (Sample) | 5.4% | 5.7% |
| Standard Deviation (Population) | 5.4% | 5.6% |
Similar Demographics by Child Poverty Under the Age of 16
Demographics Similar to South Americans by Child Poverty Under the Age of 16
In terms of child poverty under the age of 16, the demographic groups most similar to South Americans are Costa Rican (16.0%, a difference of 0.40%), Uruguayan (16.1%, a difference of 0.40%), Immigrants from Colombia (16.1%, a difference of 0.43%), Hungarian (16.2%, a difference of 0.67%), and Afghan (16.2%, a difference of 0.69%).
| Demographics | Rating | Rank | Child Poverty Under the Age of 16 |
| Immigrants | Northern Africa | 68.1 /100 | #161 | Good 15.8% |
| Colombians | 67.6 /100 | #162 | Good 15.8% |
| Yugoslavians | 67.6 /100 | #163 | Good 15.8% |
| Immigrants | Germany | 67.3 /100 | #164 | Good 15.8% |
| Guamanians/Chamorros | 66.4 /100 | #165 | Good 15.9% |
| Immigrants | Oceania | 65.4 /100 | #166 | Good 15.9% |
| Costa Ricans | 61.1 /100 | #167 | Good 16.0% |
| South Americans | 57.9 /100 | #168 | Average 16.0% |
| Uruguayans | 54.7 /100 | #169 | Average 16.1% |
| Immigrants | Colombia | 54.4 /100 | #170 | Average 16.1% |
| Hungarians | 52.5 /100 | #171 | Average 16.2% |
| Afghans | 52.3 /100 | #172 | Average 16.2% |
| Immigrants | Saudi Arabia | 52.1 /100 | #173 | Average 16.2% |
| Whites/Caucasians | 50.0 /100 | #174 | Average 16.2% |
| Scotch-Irish | 47.1 /100 | #175 | Average 16.3% |
Demographics Similar to Immigrants from Lithuania by Child Poverty Under the Age of 16
In terms of child poverty under the age of 16, the demographic groups most similar to Immigrants from Lithuania are Immigrants from Korea (13.0%, a difference of 0.31%), Norwegian (13.0%, a difference of 0.35%), Bulgarian (13.0%, a difference of 0.58%), Burmese (12.8%, a difference of 0.84%), and Cypriot (13.0%, a difference of 1.0%).
| Demographics | Rating | Rank | Child Poverty Under the Age of 16 |
| Iranians | 100.0 /100 | #7 | Exceptional 12.2% |
| Immigrants | Singapore | 100.0 /100 | #8 | Exceptional 12.4% |
| Immigrants | Iran | 100.0 /100 | #9 | Exceptional 12.4% |
| Immigrants | South Central Asia | 99.9 /100 | #10 | Exceptional 12.5% |
| Bhutanese | 99.9 /100 | #11 | Exceptional 12.5% |
| Immigrants | Ireland | 99.9 /100 | #12 | Exceptional 12.7% |
| Burmese | 99.9 /100 | #13 | Exceptional 12.8% |
| Immigrants | Lithuania | 99.9 /100 | #14 | Exceptional 12.9% |
| Immigrants | Korea | 99.9 /100 | #15 | Exceptional 13.0% |
| Norwegians | 99.9 /100 | #16 | Exceptional 13.0% |
| Bulgarians | 99.9 /100 | #17 | Exceptional 13.0% |
| Cypriots | 99.9 /100 | #18 | Exceptional 13.0% |
| Immigrants | Japan | 99.8 /100 | #19 | Exceptional 13.0% |
| Okinawans | 99.8 /100 | #20 | Exceptional 13.1% |
| Immigrants | Eastern Asia | 99.8 /100 | #21 | Exceptional 13.1% |