South American Indian vs Lithuanian Child Poverty Under the Age of 16
COMPARE
South American Indian
Lithuanian
Child Poverty Under the Age of 16
Child Poverty Under the Age of 16 Comparison
South American Indians
Lithuanians
16.4%
CHILD POVERTY UNDER THE AGE OF 16
41.8/ 100
METRIC RATING
180th/ 347
METRIC RANK
13.5%
CHILD POVERTY UNDER THE AGE OF 16
99.6/ 100
METRIC RATING
35th/ 347
METRIC RANK
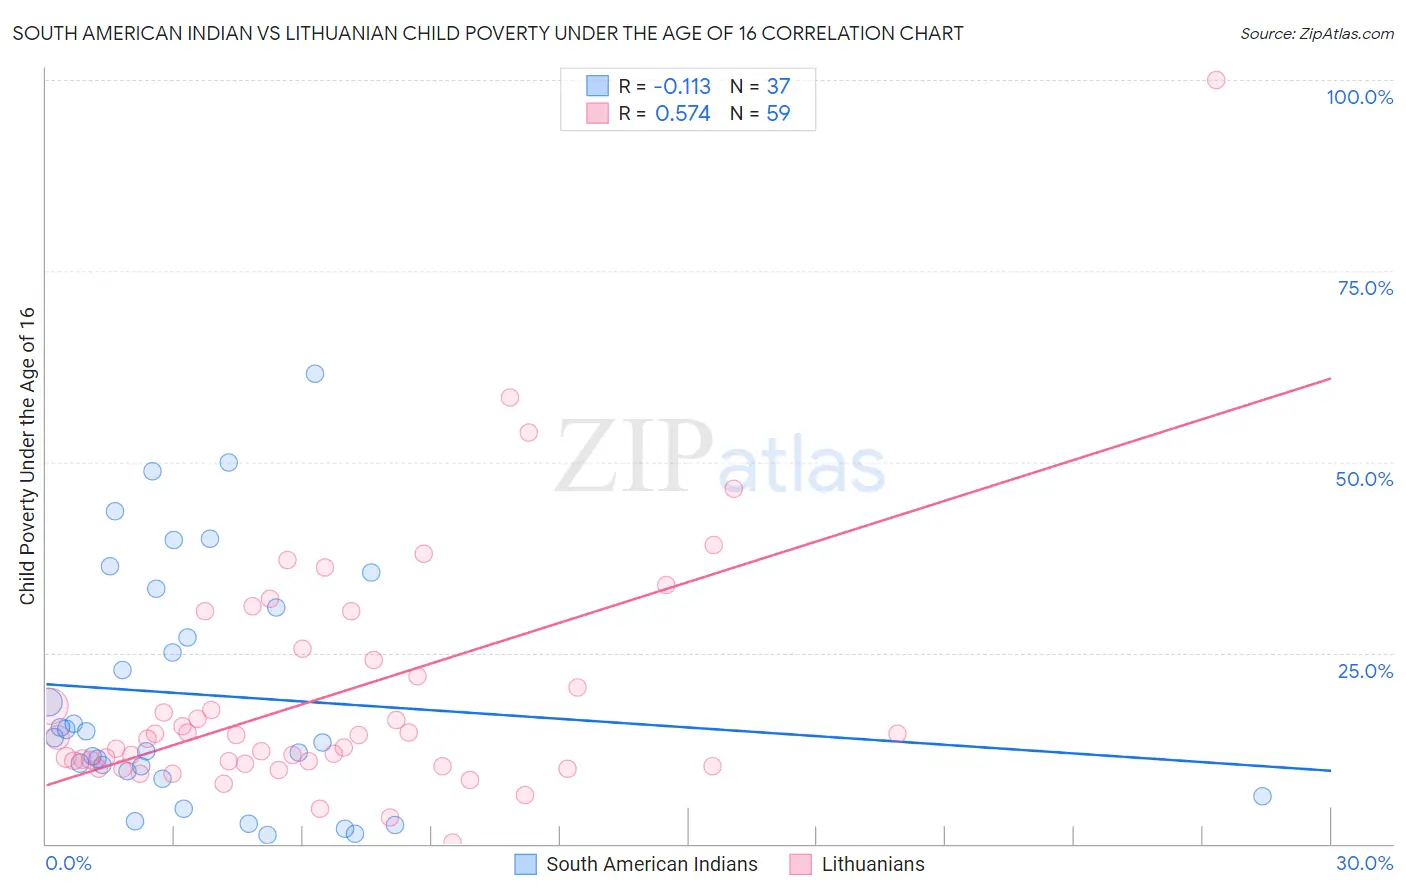
South American Indian vs Lithuanian Child Poverty Under the Age of 16 Correlation Chart
The statistical analysis conducted on geographies consisting of 164,199,892 people shows a poor negative correlation between the proportion of South American Indians and poverty level among children under the age of 16 in the United States with a correlation coefficient (R) of -0.113 and weighted average of 16.4%. Similarly, the statistical analysis conducted on geographies consisting of 415,877,620 people shows a substantial positive correlation between the proportion of Lithuanians and poverty level among children under the age of 16 in the United States with a correlation coefficient (R) of 0.574 and weighted average of 13.5%, a difference of 20.9%.
Child Poverty Under the Age of 16 Correlation Summary
| Measurement | South American Indian | Lithuanian |
| Minimum | 1.2% | 0.17% |
| Maximum | 61.5% | 100.0% |
| Range | 60.3% | 99.8% |
| Mean | 19.4% | 19.4% |
| Median | 13.9% | 13.9% |
| Interquartile 25% (IQ1) | 9.0% | 10.5% |
| Interquartile 75% (IQ3) | 32.2% | 24.0% |
| Interquartile Range (IQR) | 23.2% | 13.4% |
| Standard Deviation (Sample) | 15.8% | 16.2% |
| Standard Deviation (Population) | 15.6% | 16.1% |
Similar Demographics by Child Poverty Under the Age of 16
Demographics Similar to South American Indians by Child Poverty Under the Age of 16
In terms of child poverty under the age of 16, the demographic groups most similar to South American Indians are Immigrants from Syria (16.4%, a difference of 0.050%), Immigrants from Ethiopia (16.4%, a difference of 0.060%), Immigrants from South America (16.4%, a difference of 0.12%), Ethiopian (16.3%, a difference of 0.19%), and Hawaiian (16.4%, a difference of 0.45%).
| Demographics | Rating | Rank | Child Poverty Under the Age of 16 |
| Immigrants | Saudi Arabia | 52.1 /100 | #173 | Average 16.2% |
| Whites/Caucasians | 50.0 /100 | #174 | Average 16.2% |
| Scotch-Irish | 47.1 /100 | #175 | Average 16.3% |
| Lebanese | 45.9 /100 | #176 | Average 16.3% |
| Ethiopians | 43.4 /100 | #177 | Average 16.3% |
| Immigrants | Ethiopia | 42.3 /100 | #178 | Average 16.4% |
| Immigrants | Syria | 42.3 /100 | #179 | Average 16.4% |
| South American Indians | 41.8 /100 | #180 | Average 16.4% |
| Immigrants | South America | 40.8 /100 | #181 | Average 16.4% |
| Hawaiians | 38.2 /100 | #182 | Fair 16.4% |
| Celtics | 38.2 /100 | #183 | Fair 16.4% |
| Immigrants | Western Asia | 38.0 /100 | #184 | Fair 16.4% |
| Immigrants | Bosnia and Herzegovina | 37.4 /100 | #185 | Fair 16.5% |
| Kenyans | 34.1 /100 | #186 | Fair 16.5% |
| Arabs | 31.4 /100 | #187 | Fair 16.6% |
Demographics Similar to Lithuanians by Child Poverty Under the Age of 16
In terms of child poverty under the age of 16, the demographic groups most similar to Lithuanians are Russian (13.5%, a difference of 0.20%), Immigrants from Northern Europe (13.6%, a difference of 0.24%), Immigrants from Bolivia (13.6%, a difference of 0.26%), Asian (13.5%, a difference of 0.48%), and Luxembourger (13.6%, a difference of 0.77%).
| Demographics | Rating | Rank | Child Poverty Under the Age of 16 |
| Assyrians/Chaldeans/Syriacs | 99.7 /100 | #28 | Exceptional 13.3% |
| Swedes | 99.7 /100 | #29 | Exceptional 13.3% |
| Turks | 99.7 /100 | #30 | Exceptional 13.4% |
| Danes | 99.7 /100 | #31 | Exceptional 13.4% |
| Tongans | 99.7 /100 | #32 | Exceptional 13.4% |
| Asians | 99.6 /100 | #33 | Exceptional 13.5% |
| Russians | 99.6 /100 | #34 | Exceptional 13.5% |
| Lithuanians | 99.6 /100 | #35 | Exceptional 13.5% |
| Immigrants | Northern Europe | 99.6 /100 | #36 | Exceptional 13.6% |
| Immigrants | Bolivia | 99.6 /100 | #37 | Exceptional 13.6% |
| Luxembourgers | 99.5 /100 | #38 | Exceptional 13.6% |
| Immigrants | Australia | 99.5 /100 | #39 | Exceptional 13.6% |
| Immigrants | Scotland | 99.4 /100 | #40 | Exceptional 13.7% |
| Croatians | 99.4 /100 | #41 | Exceptional 13.8% |
| Immigrants | Sri Lanka | 99.3 /100 | #42 | Exceptional 13.8% |