South African vs Kenyan Single Mother Poverty
COMPARE
South African
Kenyan
Single Mother Poverty
Single Mother Poverty Comparison
South Africans
Kenyans
28.5%
SINGLE MOTHER POVERTY
86.6/ 100
METRIC RATING
142nd/ 347
METRIC RANK
28.4%
SINGLE MOTHER POVERTY
90.9/ 100
METRIC RATING
125th/ 347
METRIC RANK
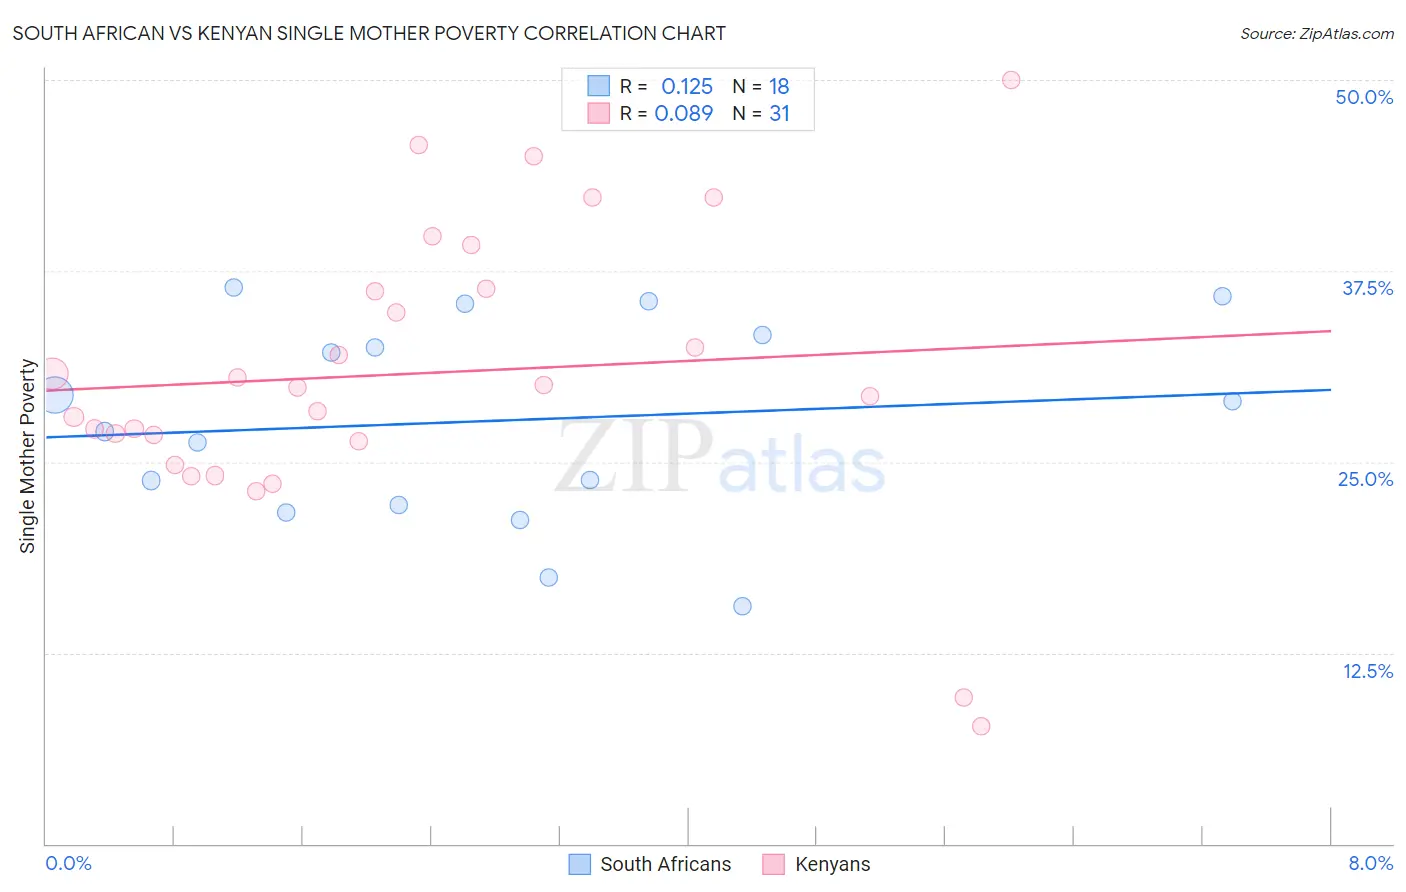
South African vs Kenyan Single Mother Poverty Correlation Chart
The statistical analysis conducted on geographies consisting of 179,638,644 people shows a poor positive correlation between the proportion of South Africans and poverty level among single mothers in the United States with a correlation coefficient (R) of 0.125 and weighted average of 28.5%. Similarly, the statistical analysis conducted on geographies consisting of 166,617,669 people shows a slight positive correlation between the proportion of Kenyans and poverty level among single mothers in the United States with a correlation coefficient (R) of 0.089 and weighted average of 28.4%, a difference of 0.53%.
Single Mother Poverty Correlation Summary
| Measurement | South African | Kenyan |
| Minimum | 15.5% | 7.7% |
| Maximum | 36.4% | 50.0% |
| Range | 20.9% | 42.3% |
| Mean | 27.7% | 30.8% |
| Median | 28.0% | 29.9% |
| Interquartile 25% (IQ1) | 22.2% | 26.3% |
| Interquartile 75% (IQ3) | 33.3% | 36.3% |
| Interquartile Range (IQR) | 11.2% | 10.0% |
| Standard Deviation (Sample) | 6.6% | 9.3% |
| Standard Deviation (Population) | 6.4% | 9.2% |
Demographics Similar to South Africans and Kenyans by Single Mother Poverty
In terms of single mother poverty, the demographic groups most similar to South Africans are Immigrants from North America (28.5%, a difference of 0.010%), Danish (28.5%, a difference of 0.050%), Immigrants from Colombia (28.5%, a difference of 0.15%), Samoan (28.5%, a difference of 0.16%), and Immigrants from Belgium (28.5%, a difference of 0.21%). Similarly, the demographic groups most similar to Kenyans are Immigrants from Chile (28.4%, a difference of 0.010%), Polish (28.4%, a difference of 0.020%), Immigrants from England (28.4%, a difference of 0.050%), South American (28.4%, a difference of 0.070%), and Norwegian (28.4%, a difference of 0.080%).
| Demographics | Rating | Rank | Single Mother Poverty |
| Uruguayans | 91.7 /100 | #123 | Exceptional 28.3% |
| Immigrants | Switzerland | 91.7 /100 | #124 | Exceptional 28.3% |
| Kenyans | 90.9 /100 | #125 | Exceptional 28.4% |
| Immigrants | Chile | 90.8 /100 | #126 | Exceptional 28.4% |
| Poles | 90.8 /100 | #127 | Exceptional 28.4% |
| Immigrants | England | 90.5 /100 | #128 | Exceptional 28.4% |
| South Americans | 90.4 /100 | #129 | Exceptional 28.4% |
| Norwegians | 90.4 /100 | #130 | Exceptional 28.4% |
| Immigrants | Austria | 90.3 /100 | #131 | Exceptional 28.4% |
| Immigrants | Morocco | 89.5 /100 | #132 | Excellent 28.4% |
| Swedes | 89.4 /100 | #133 | Excellent 28.4% |
| Immigrants | Southern Europe | 89.2 /100 | #134 | Excellent 28.4% |
| Immigrants | Spain | 89.2 /100 | #135 | Excellent 28.4% |
| Native Hawaiians | 88.9 /100 | #136 | Excellent 28.4% |
| Immigrants | Canada | 88.9 /100 | #137 | Excellent 28.4% |
| Immigrants | Belgium | 88.5 /100 | #138 | Excellent 28.5% |
| Samoans | 88.1 /100 | #139 | Excellent 28.5% |
| Immigrants | Colombia | 88.0 /100 | #140 | Excellent 28.5% |
| Danes | 87.1 /100 | #141 | Excellent 28.5% |
| South Africans | 86.6 /100 | #142 | Excellent 28.5% |
| Immigrants | North America | 86.5 /100 | #143 | Excellent 28.5% |