Somali vs Pennsylvania German Child Poverty Among Boys Under 16
COMPARE
Somali
Pennsylvania German
Child Poverty Among Boys Under 16
Child Poverty Among Boys Under 16 Comparison
Somalis
Pennsylvania Germans
21.1%
CHILD POVERTY AMONG BOYS UNDER 16
0.0/ 100
METRIC RATING
302nd/ 347
METRIC RANK
17.9%
CHILD POVERTY AMONG BOYS UNDER 16
3.9/ 100
METRIC RATING
222nd/ 347
METRIC RANK
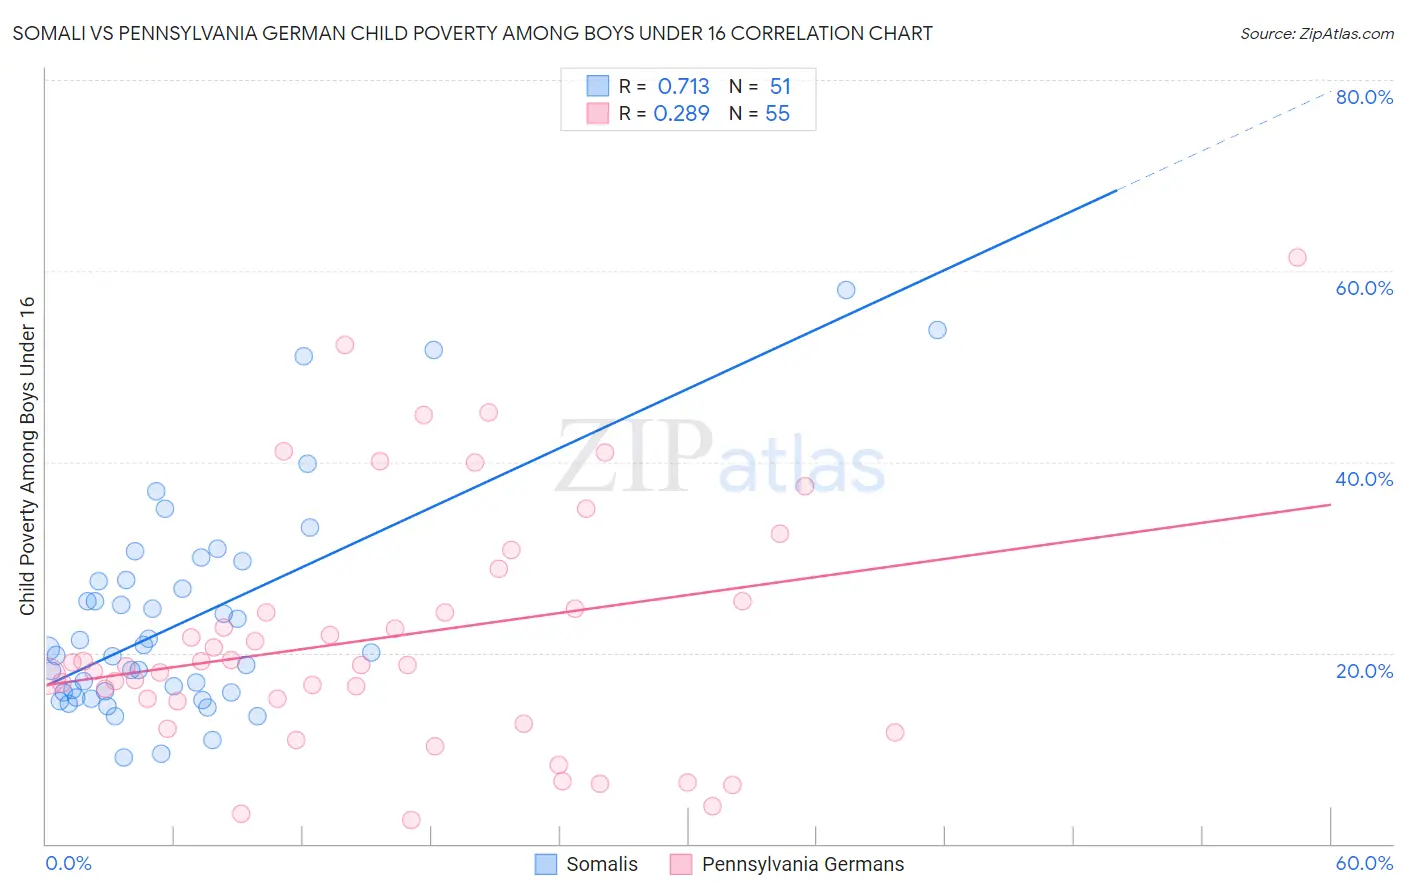
Somali vs Pennsylvania German Child Poverty Among Boys Under 16 Correlation Chart
The statistical analysis conducted on geographies consisting of 98,956,970 people shows a strong positive correlation between the proportion of Somalis and poverty level among boys under the age of 16 in the United States with a correlation coefficient (R) of 0.713 and weighted average of 21.1%. Similarly, the statistical analysis conducted on geographies consisting of 230,684,746 people shows a weak positive correlation between the proportion of Pennsylvania Germans and poverty level among boys under the age of 16 in the United States with a correlation coefficient (R) of 0.289 and weighted average of 17.9%, a difference of 18.1%.
Child Poverty Among Boys Under 16 Correlation Summary
| Measurement | Somali | Pennsylvania German |
| Minimum | 9.0% | 2.5% |
| Maximum | 58.0% | 61.4% |
| Range | 49.0% | 58.8% |
| Mean | 23.6% | 21.7% |
| Median | 20.0% | 18.7% |
| Interquartile 25% (IQ1) | 15.9% | 15.0% |
| Interquartile 75% (IQ3) | 27.7% | 25.4% |
| Interquartile Range (IQR) | 11.8% | 10.4% |
| Standard Deviation (Sample) | 11.3% | 12.8% |
| Standard Deviation (Population) | 11.2% | 12.6% |
Similar Demographics by Child Poverty Among Boys Under 16
Demographics Similar to Somalis by Child Poverty Among Boys Under 16
In terms of child poverty among boys under 16, the demographic groups most similar to Somalis are Guatemalan (21.1%, a difference of 0.0%), Haitian (21.0%, a difference of 0.54%), Immigrants from Haiti (21.3%, a difference of 0.54%), Immigrants from Caribbean (21.0%, a difference of 0.59%), and Immigrants from Central America (21.3%, a difference of 0.59%).
| Demographics | Rating | Rank | Child Poverty Among Boys Under 16 |
| Mexicans | 0.0 /100 | #295 | Tragic 20.7% |
| Indonesians | 0.0 /100 | #296 | Tragic 20.8% |
| Hispanics or Latinos | 0.0 /100 | #297 | Tragic 20.9% |
| Chippewa | 0.0 /100 | #298 | Tragic 21.0% |
| Immigrants | Caribbean | 0.0 /100 | #299 | Tragic 21.0% |
| Haitians | 0.0 /100 | #300 | Tragic 21.0% |
| Guatemalans | 0.0 /100 | #301 | Tragic 21.1% |
| Somalis | 0.0 /100 | #302 | Tragic 21.1% |
| Immigrants | Haiti | 0.0 /100 | #303 | Tragic 21.3% |
| Immigrants | Central America | 0.0 /100 | #304 | Tragic 21.3% |
| Kiowa | 0.0 /100 | #305 | Tragic 21.3% |
| Immigrants | Grenada | 0.0 /100 | #306 | Tragic 21.3% |
| Choctaw | 0.0 /100 | #307 | Tragic 21.3% |
| Immigrants | Mexico | 0.0 /100 | #308 | Tragic 21.5% |
| Seminole | 0.0 /100 | #309 | Tragic 21.5% |
Demographics Similar to Pennsylvania Germans by Child Poverty Among Boys Under 16
In terms of child poverty among boys under 16, the demographic groups most similar to Pennsylvania Germans are Cuban (17.9%, a difference of 0.090%), Immigrants from Panama (17.9%, a difference of 0.23%), Nepalese (18.0%, a difference of 0.56%), Immigrants from Cambodia (17.8%, a difference of 0.71%), and Sierra Leonean (17.8%, a difference of 0.84%).
| Demographics | Rating | Rank | Child Poverty Among Boys Under 16 |
| Osage | 5.8 /100 | #215 | Tragic 17.7% |
| Moroccans | 5.6 /100 | #216 | Tragic 17.7% |
| Japanese | 5.5 /100 | #217 | Tragic 17.7% |
| Iraqis | 5.5 /100 | #218 | Tragic 17.7% |
| Sierra Leoneans | 5.3 /100 | #219 | Tragic 17.8% |
| Immigrants | Cambodia | 5.1 /100 | #220 | Tragic 17.8% |
| Immigrants | Panama | 4.3 /100 | #221 | Tragic 17.9% |
| Pennsylvania Germans | 3.9 /100 | #222 | Tragic 17.9% |
| Cubans | 3.8 /100 | #223 | Tragic 17.9% |
| Nepalese | 3.2 /100 | #224 | Tragic 18.0% |
| Inupiat | 2.7 /100 | #225 | Tragic 18.1% |
| Immigrants | Africa | 2.6 /100 | #226 | Tragic 18.1% |
| Bermudans | 2.5 /100 | #227 | Tragic 18.1% |
| Immigrants | Nonimmigrants | 2.2 /100 | #228 | Tragic 18.2% |
| Immigrants | Micronesia | 1.8 /100 | #229 | Tragic 18.3% |