Slovak vs Colombian Child Poverty Among Boys Under 16
COMPARE
Slovak
Colombian
Child Poverty Among Boys Under 16
Child Poverty Among Boys Under 16 Comparison
Slovaks
Colombians
15.8%
CHILD POVERTY AMONG BOYS UNDER 16
80.3/ 100
METRIC RATING
149th/ 347
METRIC RANK
16.1%
CHILD POVERTY AMONG BOYS UNDER 16
65.2/ 100
METRIC RATING
165th/ 347
METRIC RANK
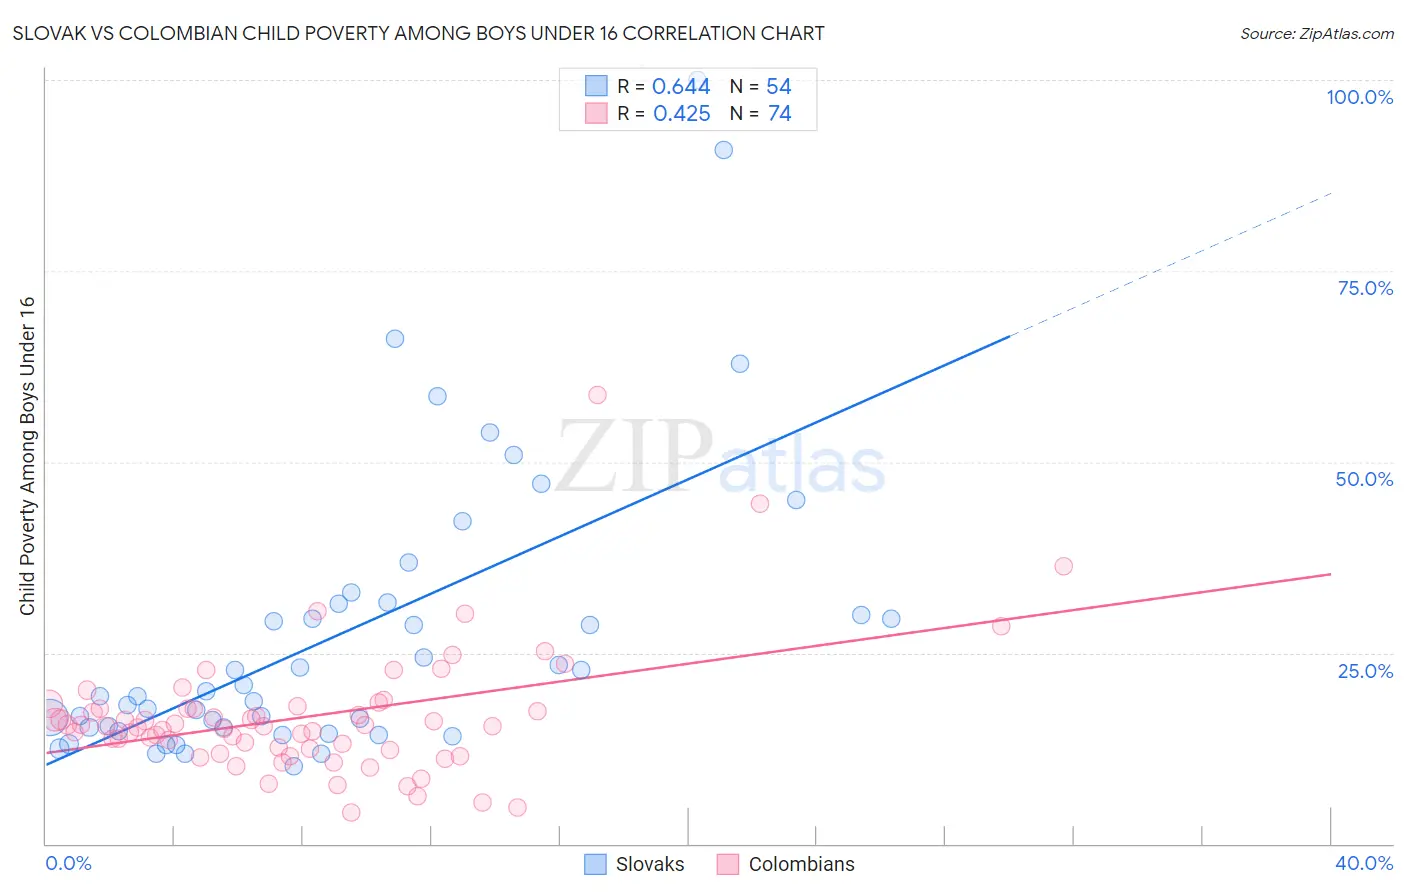
Slovak vs Colombian Child Poverty Among Boys Under 16 Correlation Chart
The statistical analysis conducted on geographies consisting of 388,579,865 people shows a significant positive correlation between the proportion of Slovaks and poverty level among boys under the age of 16 in the United States with a correlation coefficient (R) of 0.644 and weighted average of 15.8%. Similarly, the statistical analysis conducted on geographies consisting of 412,508,797 people shows a moderate positive correlation between the proportion of Colombians and poverty level among boys under the age of 16 in the United States with a correlation coefficient (R) of 0.425 and weighted average of 16.1%, a difference of 2.3%.
Child Poverty Among Boys Under 16 Correlation Summary
| Measurement | Slovak | Colombian |
| Minimum | 10.2% | 4.0% |
| Maximum | 100.0% | 58.8% |
| Range | 89.8% | 54.7% |
| Mean | 27.6% | 16.6% |
| Median | 19.6% | 15.4% |
| Interquartile 25% (IQ1) | 15.2% | 12.4% |
| Interquartile 75% (IQ3) | 31.5% | 17.7% |
| Interquartile Range (IQR) | 16.3% | 5.3% |
| Standard Deviation (Sample) | 19.3% | 8.3% |
| Standard Deviation (Population) | 19.2% | 8.3% |
Demographics Similar to Slovaks and Colombians by Child Poverty Among Boys Under 16
In terms of child poverty among boys under 16, the demographic groups most similar to Slovaks are Immigrants from Jordan (15.8%, a difference of 0.010%), Puget Sound Salish (15.8%, a difference of 0.090%), Brazilian (15.8%, a difference of 0.14%), Immigrants from Venezuela (15.8%, a difference of 0.14%), and French (15.8%, a difference of 0.28%). Similarly, the demographic groups most similar to Colombians are Immigrants from Germany (16.2%, a difference of 0.20%), Immigrants from Albania (16.1%, a difference of 0.35%), Costa Rican (16.1%, a difference of 0.38%), Guamanian/Chamorro (16.1%, a difference of 0.58%), and Immigrants from Oceania (16.0%, a difference of 0.81%).
| Demographics | Rating | Rank | Child Poverty Among Boys Under 16 |
| Venezuelans | 82.1 /100 | #147 | Excellent 15.7% |
| Brazilians | 81.0 /100 | #148 | Excellent 15.8% |
| Slovaks | 80.3 /100 | #149 | Excellent 15.8% |
| Immigrants | Jordan | 80.2 /100 | #150 | Excellent 15.8% |
| Puget Sound Salish | 79.8 /100 | #151 | Good 15.8% |
| Immigrants | Venezuela | 79.5 /100 | #152 | Good 15.8% |
| French | 78.7 /100 | #153 | Good 15.8% |
| Syrians | 77.5 /100 | #154 | Good 15.9% |
| French Canadians | 76.6 /100 | #155 | Good 15.9% |
| Israelis | 76.5 /100 | #156 | Good 15.9% |
| Immigrants | Nepal | 76.0 /100 | #157 | Good 15.9% |
| Yugoslavians | 75.9 /100 | #158 | Good 15.9% |
| Immigrants | Chile | 74.8 /100 | #159 | Good 15.9% |
| Immigrants | Northern Africa | 71.3 /100 | #160 | Good 16.0% |
| Immigrants | Oceania | 71.3 /100 | #161 | Good 16.0% |
| Guamanians/Chamorros | 69.6 /100 | #162 | Good 16.1% |
| Costa Ricans | 68.1 /100 | #163 | Good 16.1% |
| Immigrants | Albania | 67.9 /100 | #164 | Good 16.1% |
| Colombians | 65.2 /100 | #165 | Good 16.1% |
| Immigrants | Germany | 63.6 /100 | #166 | Good 16.2% |
| Afghans | 55.4 /100 | #167 | Average 16.3% |